IMAGE

Fig. 2

ID
ZDB-IMAGE-231222-3
Source
Figures for Lyu et al., 2023
Image
Figure Caption

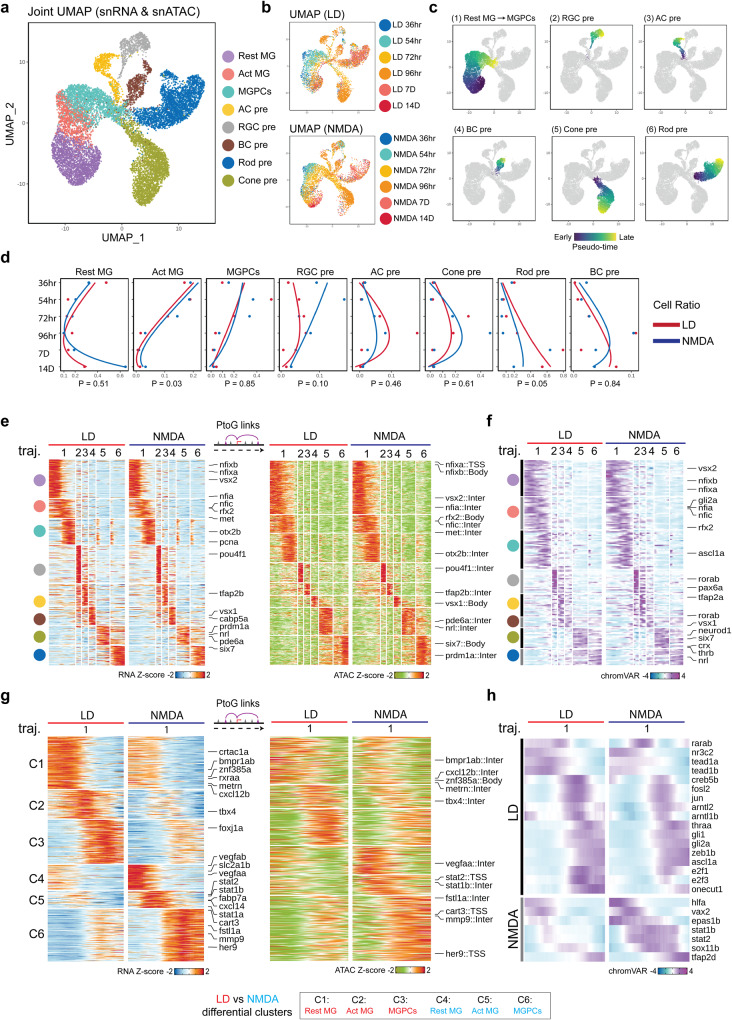
Fig. 2 Shared and differential patterns of gene expression and chromatin accessibility data observed in MG-derived cells following LD and NMDA treatment.

a, b Combined UMAP projection of Müller glia (MG) and progenitor neuron cells profiled using multiomic sequencing. Each point (cell) is colored by cell type (a) and time points (b). Resting (Rest); Activated (Act); MG-derived progenitor cells (MGPCs); amacrine cell (AC); retinal ganglion cell (RGC); bipolar cell (BC); precursor (pre). c UMAPs showing trajectories constructed from mutiomics datasets of combined light damage (LD) and NMDA datasets. Color indicates pseudotime state. d Line graphs showing the fraction of cells (x axis) at each time point (y axis) of each cell type. Lines are colored by treatment. The paired t-test were used to compare the cell fraction from LD and NMDA. p values are labeled at the bottom of the graph. e Heatmap shows the consensus marker genes and their related marker peaks (TSS and enhancer) between LD and NMDA treatment for each cell type. f Heatmap shows the consensus motifs between LD and NMDA treatment for each cell type. g Heatmap shows the differential genes and their related differential peaks (TSS and enhancer) between LD and NMDA treatment for MG (Rest), MG (Act) and MGPCs. h Heatmap shows the differential motifs between LD and NMDA treatment for MG (Rest), MG(Act), and MGPCs.

Acknowledgments
This image is the copyrighted work of the attributed author or publisher, and ZFIN has permission only to display this image to its users. Additional permissions should be obtained from the applicable author or publisher of the image. Full text @ Nat. Commun.