IMAGE

Fig. 5

ID
ZDB-IMAGE-231222-7
Source
Figures for Lyu et al., 2023
Image
Figure Caption

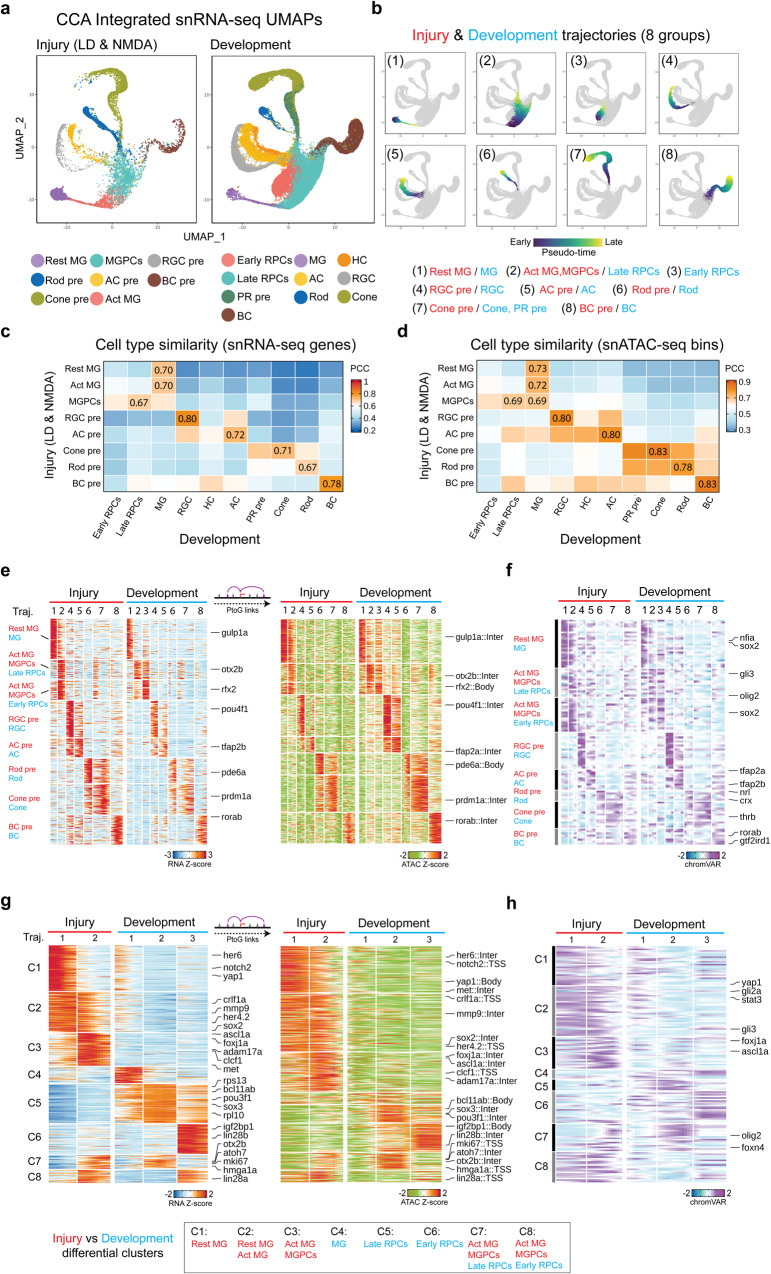
Fig. 5 Shared and differential features of MG-derived cells between injury and development datasets

a Integrated UMAP projection of Müller glia (MG) and progenitor neuron cells using injury (light damage (LD) and NMDA; left) and development (right) snRNA-Seq datasets. Each point (cell) is colored by cell type in each dataset. Resting (Rest); Activated (Act); MG-derived progenitor cells (MGPCs); amacrine cell (AC); retinal ganglion cell (RGC); bipolar cell (BC); precursor (pre); retinal progenitor cell (RPC); photoreceptor (PR); horizontal cell (HC). b UMAPs showing the eight trajectories (groups) constructed from the integrated UMAPs of combined injury and development datasets. Color indicates pseudotime state. The label indicates the cell types included for each trajectory. The heatmap displays the Pearson correlations between the cell types from the injury and development datasets using snRNA-Seq RNA expression (c) and snATAC-seq bin signals (d). The highest correlation score for each injury cell type is labeled on the heatmap. e Heatmap shows the consensus marker genes and their related marker peaks (TSS and enhancer) between injury and development model for each group. f Heatmap shows the consensus motifs between injury and development model for each group. g Heatmap shows the differential genes and their related differential peaks (TSS and enhancer) between injury and development model for MG groups (group1 and group2). h Heatmap shows the differential motifs between injury and development model for MG groups (group1 and group2).

Acknowledgments
This image is the copyrighted work of the attributed author or publisher, and ZFIN has permission only to display this image to its users. Additional permissions should be obtained from the applicable author or publisher of the image. Full text @ Nat. Commun.