IMAGE

Fig. 3

ID
ZDB-IMAGE-231222-4
Source
Figures for Lyu et al., 2023
Image
Figure Caption

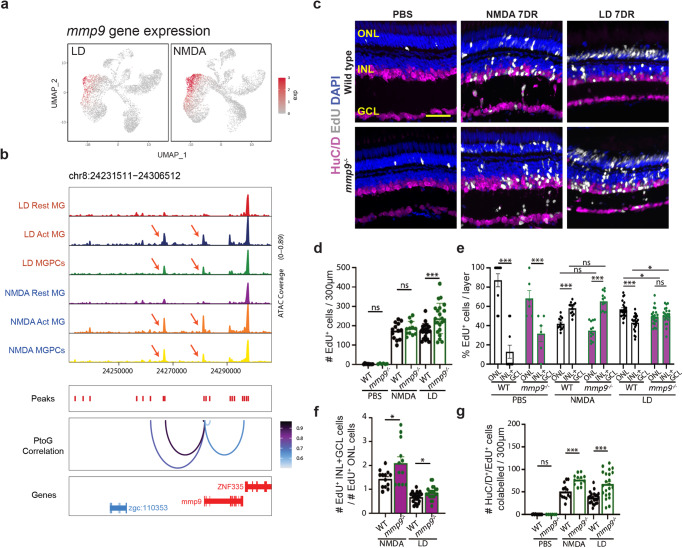
Fig. 3 Mmp9 selectively inhibits generation of inner retinal neurons from MGPCs.

a UMAP plot showing expression pattern of mmp9 in LD (light damage) and NMDA-treated retina. b Altered chromatin accessibility in putative regulatory sequences associated with mmp9 following both LD and NMDA damage. c PBS-injected control, NMDA-treated, and LD retinas at 7 days recovery (DR) immunostained with HuC/D to label retinal ganglion cells and amacrine cells, EdU, and counterstained with DAPI. Outer nuclear layer (ONL); inner nuclear layer (INL); ganglion cell layer (GCL). d Quantification of the number of EdU-labeled cells in all three retinal layers in wild-type (WT) and mmp9 mutants following either PBS injection, NMDA damage, or LD. (PBS) WT n = 10, mmp9−/−n = 6; (NMDA) WT n = 13, mmp9−/−n = 12; (LD) WT n = 23, mmp9−/−n = 22. Three replicate experiments. e The percentage of EdU-positive cells in the ONL vs. the INL + GCL is plotted for wild-type and mmp9 mutant retinas after PBS injection, NMDA damage, and light damage. (PBS) WT n = 10, mmp9−/−n = 6; (NMDA) WT n = 13, mmp9−/−n = 12; (LD) WT n = 23, mmp9−/−n = 22. Three replicate experiments. f The ratio of EdU-positive ONL cells to EdU-positive INL + GCL cells is plotted for wild-type and mmp9 mutant fish following either NMDA damage or light damage. (NMDA) WT n = 13, mmp9−/−n = 12; (LD) WT n = 23, mmp9−/−n = 22. Three replicate experiments. g Quantification of the number of cells colabelled for EdU and HuC/D in PBS-injected, NMDA-injected, and light-damaged retinas. (PBS) WT n = 10, mmp9−/−n = 6; (NMDA) WT n = 13, mmp9−/−n = 12; (LD) WT n = 23, mmp9−/−n = 22. Three replicate experiments. Magenta bars indicate data from mmp9 mutants. Scale bar in (c) is 20 μm. dg Data are presented as mean values ± SEM. Students’ t test was performed for (d, f, g), while two-way ANOVA with Bonferroni’s post hoc test for (e). Asterisks indicate statistically significant differences between the indicated groups (*p ≤ 0.05, ***p ≤ 0.001). Source data are provided as a Source Data file 1.

Acknowledgments
This image is the copyrighted work of the attributed author or publisher, and ZFIN has permission only to display this image to its users. Additional permissions should be obtained from the applicable author or publisher of the image. Full text @ Nat. Commun.