IMAGE

Fig. 6

ID
ZDB-IMAGE-231222-8
Source
Figures for Lyu et al., 2023
Image
Figure Caption

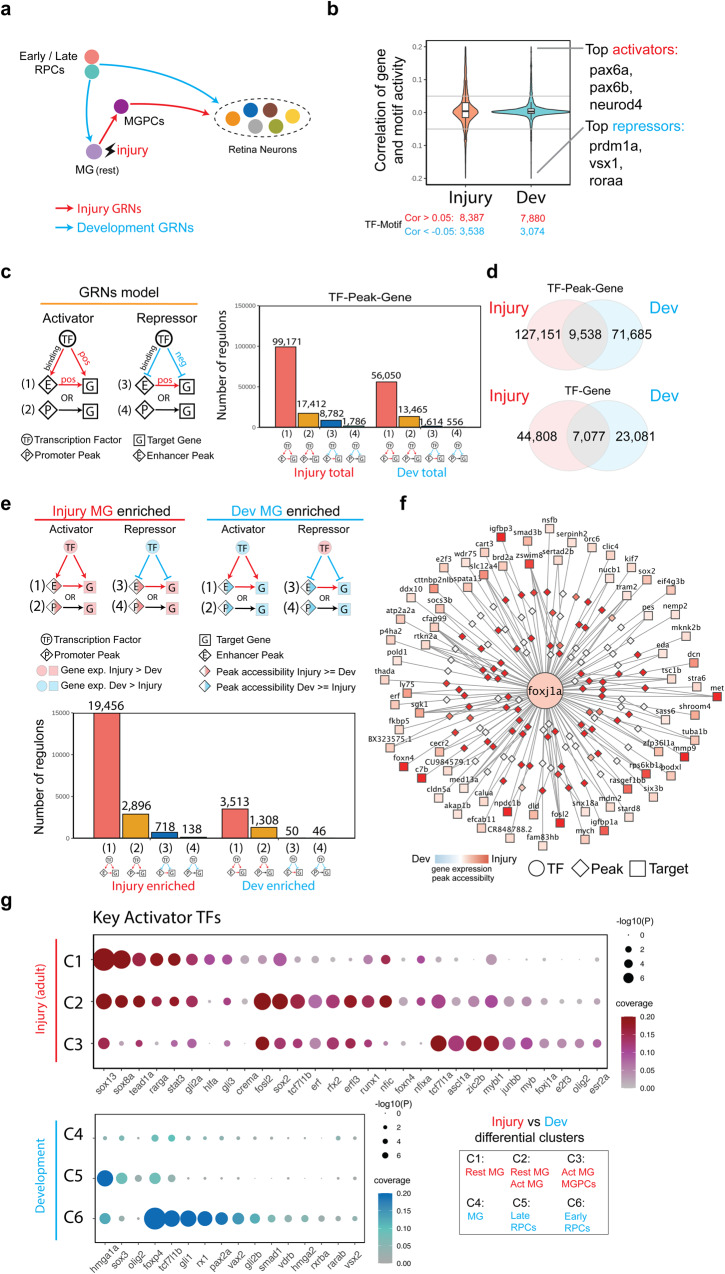
Fig. 6 Transcription factors controlling differential expression genes in MGPC in injured retina and progenitor cells in developing retina.

a Schematic of gene regulatory networks (GRNs) that direct retinal progenitor cell (RPC) differentiation during development, Müller glia (MG) reprogramming following injury, and MG-derived progenitor cell (MGPC) differentiation during regeneration. b Inference of activator and repressor function for each individual transcription factor from multiomic datasets. The y-axis represents the correlation distribution between gene expression and chromVAR score. The top three activator and repressor TFs are shown on the right. The center, lower/upper bound of the boxplot shows the median, 25th and 75th of the correlations, The whiskers extend from the ends of the box to the smallest and largest values that are within 1.5 times the IQR from the lower and upper quartiles, respectively. c Gene regulatory networks of injury and development datasets. (left) Triple regulons model, A circle indicates a TF, a rectangle indicates a target gene, and a diamond indicates a peak (right) barplot shows the number of types of regulons. d Venn diagram shows the overlap of regulons between injury and development GRNs. e Enriched gene regulatory networks of injury and development. (Left) Enriched Triple regulons model for each condition. A circle indicates a TF, a rectangle indicates a target gene, and a diamond indicates a peak. Color indicates the log2 fold change of gene/peak between injury and developmental datasets. (Right) barplot shows the number of different types of regulons between injury and development enriched GRNs. f An example of foxj1a regulons. Color indicates the log2 fold change of gene/peak between injury and developmental datasets. A circle indicates a TF, a rectangle indicates a target gene, and a diamond indicates a peak. g Dotplot showing key activator TFs for each divergent gene cluster. The color of the dot showing the gene ratio and the size indicates the p value of the TF’s regulatory specificity of the regulatory relationship. Hypergeometric test were used test whether the TF’s targets are enriched in the DEG clusters.

Acknowledgments
This image is the copyrighted work of the attributed author or publisher, and ZFIN has permission only to display this image to its users. Additional permissions should be obtained from the applicable author or publisher of the image. Full text @ Nat. Commun.