|
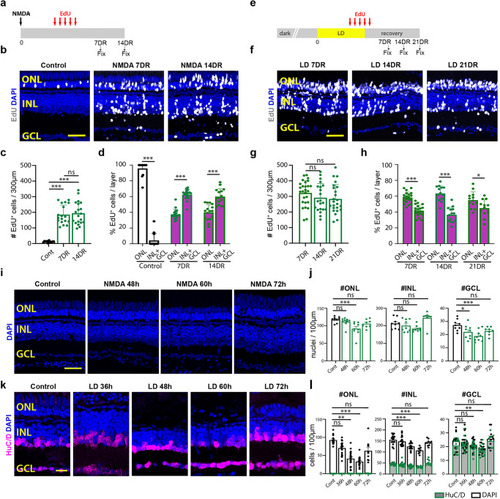
Comparison of NMDA-induced and light-induced retinal damage. a Schematic of NMDA-induced damage experiment. b EdU-labeling in control retinas and following NMDA damage. c Quantification of the number of EdU-labeled cells in all three retinal layers. Control (Cont) n = 13, 7 days recovery (DR) n = 18, 14DR n = 20. Three independent experiments. d The percentage of EdU-labeled cells in the Outer Nuclear Layer (ONL) vs. combined in the Inner Nuclear Layer (INL) and Ganglion Cell Layer (GCL). Cont ONL and INL + GCL n = 13; 7DR ONL and INL + GCL n = 18, 14DR ONL and INL + GCL n = 20. Three independent experiments. e Schematic of light-induced damage (LD) experiment. f EdU-labeling following light damage (LD). g Quantification of the number of EdU-labeled cells in all three retinal layers. 7DR n = 27, 14DR n = 21, 21DR n = 24. Three independent experiments. h The percentage of the EdU-labeled cells in the ONL vs. combined in the INL + GCL. 7DR ONL and INL + GCL n = 27; 14DR ONL and INL + GCL n = 24; 21DR ONL and INL + GCL n = 24. Three independent experiments. i DAPI staining of undamaged retinas and 48, 60, and 72 h after injecting NMDA. j Quantification of the number of DAPI-labeled nuclei in the ONL, INL, and GCL. Cont, 48 h, and 60 h (ONL, INL, GCL) n = 9; 72 h (ONL, INL, GCL) n = 8. k DAPI and HuC/D staining of undamaged retinas and 36, 48, 60, and 72 h after starting constant light treatment. l Quantification of the number of DAPI- or HuC/D-labeled nuclei in the ONL, INL, and GCL. Cont (ONL, INL, GCL) n = 15; 36 h (ONL, INL, GCL) n = 20; 48 h (ONL, INL, GCL) n = 17; 60 h (ONL, INL, GCL) n = 16; 72 h (ONL, INL, GCL) n = 10. Scale bars in (b, f, i) are 20 μm and in (k) is 14 μm. c–h, j, l Data are presented as mean values ± SEM. For statistical analysis, one-way ANOVA was followed by t-test with Dunnett’s method for multiple comparisons correction. Asterisks indicate statistically significant differences between the indicated groups (*p ≤ 0.05, **p ≤ 0.01, ***p ≤ 0.001). Source data are provided as a Source Data file 1.
|