FIGURE SUMMARY
Title

Modulation of tooth regeneration through opposing responses to Wnt and BMP signals in teleosts

Authors
Square, T.A., Mackey, E.J., Sundaram, S., Weksler, N.C., Chen, Z.Z., Narayanan, S.N., Miller, C.T.
Source
Full text @ Development

In situ hybridization reveals dynamic expression of Wnt10a, Dkk2, Bmp6 and Grem2a within and surrounding pharyngeal teeth in wild-type sticklebacks. (A-N) The basal-most layer of epithelium is flanked by black dotted lines in each image. Arrows mark dental epithelium and arrowheads mark dental mesenchyme, with black markers indicating detected expression and white markers indicating regions with no detected expression; brackets mark mesenchymal expression outside of tooth organs; carets mark the successional dental epithelium. Bony tissues are false-colored red. Tooth stages and genes are labeled in the figure. Each expression pattern presented was observed in at least n=3 individuals. (O) A diagram showing bud, mid-bell, eruption, and erupted teeth summarizing the expression domains observed. The dotted lines demarcate the basal-most layer of epithelium. The hashed domain in the erupted stage indicates that these genes are not always observed in the successional dental epithelium of an erupted tooth. Descriptions of the location of the successional dental epithelium can be found in Fig. 10 in this paper and figure 6 in Square et al. (2021). Scale bars: 20 μm.

Two-stain pulse-chase method for assessing tooth turnover. (A-A″) Example images of the pulse-chase method on a control stickleback. (A) Alizarin Red strongly marks all bone undergoing active ossification at the start of the treatment (magenta). (A′) 18 days later, after 36 heat shocks, a calcein chase marks all bone ossifying at the end of the treatment (green). (A″) An overlay of Alizarin Red and calcein reveals whether individual teeth were either present at only the second labeling (new; calcein only, example labeled ‘n’) or present at both the first and second labeling (retained; Alizarin Red and calcein positive, example labeled ‘r’). (B) An example overlay of the pulse-chase treatment on zebrafish teeth using the same treatment interval. Scale bars: 25 μm.

Wnt10a overexpression causes accelerated new tooth formation in stickleback and zebrafish. All P-values are derived from Wilcoxon Rank-Sum tests, adjusted for multiple hypothesis testing. (A) In stickleback, the number of new teeth (P=0.0015), retained teeth (P=0.032), and the new:retained ratio (P=0.0012) showed significant differences between WT and OE fish; however, the total number of teeth did not (P=0.77) (n=18 control and 20 OE fish). (B,C) Overlay images of stickleback ventral tooth plates showing Alizarin Red and calcein signal in control (B) and OE (C) individuals. Note clusters of new teeth (white dotted oval showing an example on the left VTP). (D) In zebrafish, significant increases in the number of new teeth (P=0.0016), the new:retained ratio (P=0.0084) and total teeth (P=0.014) were found, but retained tooth number (P=0.56) did not significantly change (n=14 control and 15 OE fish). Boxes represent the 25th-75th percentiles, the median is shown as a black bar, and whiskers represent those data within 1.5× the interquartile range above and below the 75th and 25th percentiles, respectively. *P<0.05, **P<0.01. n.s., not significant. Scale bars: 100 μm.

Dkk2 overexpression diminishes new tooth initiation in stickleback. All P-values are derived from Wilcoxon Rank-Sum tests, adjusted for multiple hypothesis testing. (A) Significant decreases in the number of new teeth (P=0.00049), the new:retained ratio (P=4.3e-5) and total teeth (P=0.0048), and an increase in retained teeth (P=0.037) were observed (n=10 control, 10 OE fish). (B,C) Overlay images of stickleback ventral tooth plates showing Alizarin Red and calcein signal in control (B) and OE (C) fish. Note the near-complete absence of unankylosed new teeth in the OE fish (white arrow in C) compared with the WT fish (white arrows in B). The right side is unlabeled. (D,E) H&E staining on transverse sections of tooth fields reveals no tooth germs of any stage in Dkk2 OE fish (n=7/7), suggesting that this treatment does not cause tooth germs to arrest (yellow ovals in D show tooth germs, asterisks in E sit above the positions normally populated by tooth germs). Boxes represent the 25th-75th percentiles, the median is shown as a black bar, and whiskers represent those data within 1.5× the interquartile range above and below the 75th and 25th percentiles, respectively. *P<0.05, **P<0.01, ***P<0.001. Scale bars: 100 μm.

Stalled tooth germs resulting from Bmp6 overexpression. (A-B″) A shows WT control, B shows OE transgene carrier. A and B show brightfield, A′ and B′ show green channel fluorescence (calcein), and A″ and B″ show an overlay. Note that there was no calcein signal in the four tooth germs indicated in the Bmp6 OE fish (gray arrows in B′). Black arrows otherwise mark tooth germs in those panels where they are visible. Scale bars: 25 μm.

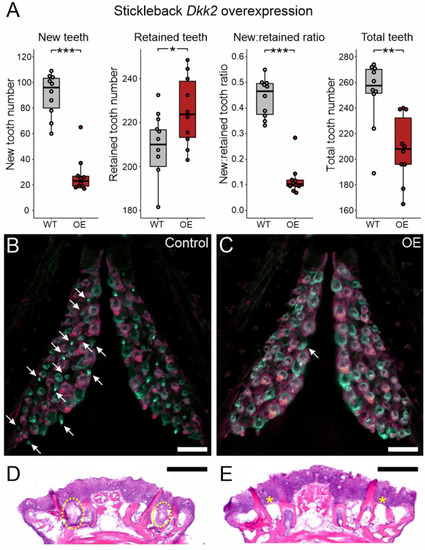
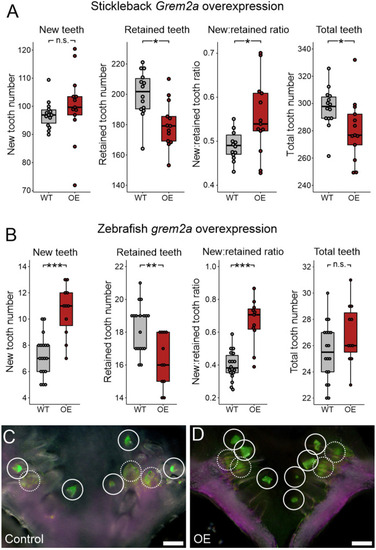
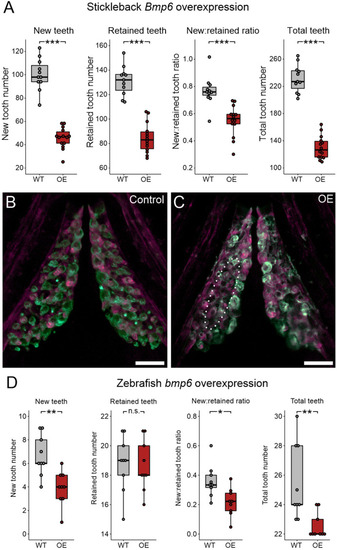
Bmp6 overexpression limits new tooth development in stickleback and zebrafish. All P-values are derived from Wilcoxon Rank-Sum tests, adjusted for multiple hypothesis testing. (A) In sticklebacks, significant decreases in all four variables were detected: the number of new teeth (P=3.7e−5), the number of retained teeth (P=3.7e−5), the new:retained ratio (P=4.4e−5) and total teeth (P=3.7e−5), (n=11 control, 14 OE fish). (B,C) Overlay images of stickleback ventral tooth plates showing Alizarin Red and calcein signal in control (B) and OE (C) fish. Note that regions usually populated with ankylosed teeth are devoid of any such structure (dotted oval in D). Right side is unlabeled. (D) In zebrafish, significant decreases in the number of new teeth (P=0.0084), the new:retained ratio (P=0.018) and total teeth (P=0.0084) were detected, but retained tooth number (P=0.79) did not significantly change (n=9 control, 9 OE fish). Boxes represent the 25th-75th percentiles, the median is shown as a black bar, and whiskers represent those data within 1.5× the interquartile range above and below the 75th and 25th percentiles, respectively. *P<0.05, **P<0.01, ***P<0.001. n.s., not significant. Scale bars: 100 μm.

RNA-seq reveals transcriptional changes associated with Bmp6 overexpression.n=3 each control and OE ventral tooth plates were collected ∼12 h after a single heat shock and subjected to RNA-seq. Each fish's normalized read count is shown for each gene, and a gray bar indicates the mean of each group. We found increased transcription of Wnt inhibitors (Dact2, Dkk1, Sfrp2l and Sost) and reduced expression of Wnt10a, Tcf21 and Eda. *P<0.05, **P<0.01, ***P<0.001 (Wald tests, corrected for multiple hypothesis testing).

Bmp6 OE caused a reduction of TCF/Lef reporter activity in successional dental epithelia. (A,A′) Images of WT pharyngeal tooth fields with a TCF/Lef reporter transgene. Arrows mark tooth germs, arrowhead marks successional dental epithelium. A′ shows an enlarged region of A as marked by the white dotted box. (B,C) Control (B) and OE (C) example images of pharyngeal teeth with the same reporter construct. Note the GFP-positive successional dental epithelia in the control individual (arrowheads). (D) A box and whisker plot showing the number of TCF/Lef-positive successional dental epithelia (SDE). Boxes represent the 25th-75th percentiles, the median is shown as a black bar, and whiskers represent those data within 1.5× the interquartile range above and below the 75th and 25th percentiles, respectively. Wilcoxon Rank-Sum test, **P<0.01 (P=0.0021; n=6 control, 9 OE fish). Scale bars: 100 μm (A-C); 25 μm (A′).

Effects of Grem2a overexpression in stickleback and zebrafish. All P-values are derived from Wilcoxon Rank-Sum tests, adjusted for multiple hypothesis testing. (A) In sticklebacks, significant decrease in the number of retained teeth (P=0.018), a significant increase in the new:retained ratio (P=0.039) and total teeth (P=0.029), but no significant changes to new teeth (P=0.11) were observed (n=14 control, 13 OE fish). (B) In zebrafish, significant increases in the number of new teeth (P=0.00062) and the new:retained ratio (P=0.00053), a significant decrease in retained teeth (P=0.0062), and no significant change in total teeth (P=0.14) was observed (n=18 control, 11 OE fish). (C,D) Overlay images of zebrafish ventral tooth plates showing Alizarin Red and calcein signal in control (B) and OE (C) fish. White circles indicate new teeth (solid circles mark superficial teeth, and dotted circles mark teeth deep in the tooth field that are occluded by erupted teeth). Boxes represent the 25th-75th percentiles, the median is shown as a black bar, and whiskers represent those data within 1.5× the interquartile range above and below the 75th and 25th percentiles, respectively. *P<0.05, **P<0.01, ***P<0.001. n.s., not significant. Scale bars: 100 μm.

Modulation of tooth regeneration through opposing responses to Wnt and BMP signals in teleosts. Diagram summarizing the results of this study. Three stages of tooth replacement are shown for each fish species; the site of each event is indicated by the dashed ovals in the diagrams. In both fish species, the initiation stage is hypothesized to occur at the successional dental epithelium (which in zebrafish is arranged as a successional dental lamina). Thereafter, tooth germs differentiate and grow in size as they deposit dentine and enameloid. Later, tooth dissociation occurs, thus making space for the new tooth. Arrows and hammers indicate that a given gene overexpression treatment yielded a significant increase or decrease in the indicated event, respectively. Note that these could be indirect effects; for example, stickleback Wnt10a may increase tooth dissociation indirectly by increasing tooth initiation.

Acknowledgments
This image is the copyrighted work of the attributed author or publisher, and ZFIN has permission only to display this image to its users. Additional permissions should be obtained from the applicable author or publisher of the image. Full text @ Development