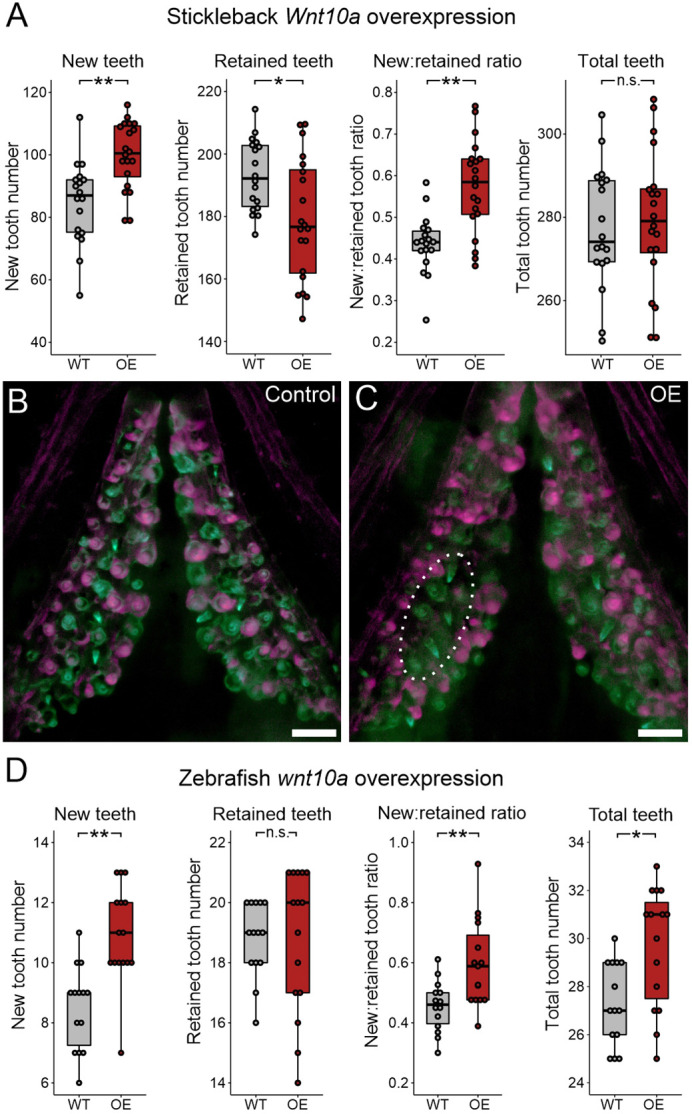
IMAGE

Fig. 3.

ID
ZDB-IMAGE-231220-43
Source
Figures for Square et al., 2023
Image
Figure Caption

Fig. 3.

Wnt10a overexpression causes accelerated new tooth formation in stickleback and zebrafish. All P-values are derived from Wilcoxon Rank-Sum tests, adjusted for multiple hypothesis testing. (A) In stickleback, the number of new teeth (P=0.0015), retained teeth (P=0.032), and the new:retained ratio (P=0.0012) showed significant differences between WT and OE fish; however, the total number of teeth did not (P=0.77) (n=18 control and 20 OE fish). (B,C) Overlay images of stickleback ventral tooth plates showing Alizarin Red and calcein signal in control (B) and OE (C) individuals. Note clusters of new teeth (white dotted oval showing an example on the left VTP). (D) In zebrafish, significant increases in the number of new teeth (P=0.0016), the new:retained ratio (P=0.0084) and total teeth (P=0.014) were found, but retained tooth number (P=0.56) did not significantly change (n=14 control and 15 OE fish). Boxes represent the 25th-75th percentiles, the median is shown as a black bar, and whiskers represent those data within 1.5× the interquartile range above and below the 75th and 25th percentiles, respectively. *P<0.05, **P<0.01. n.s., not significant. Scale bars: 100 μm.

Acknowledgments
This image is the copyrighted work of the attributed author or publisher, and ZFIN has permission only to display this image to its users. Additional permissions should be obtained from the applicable author or publisher of the image. Full text @ Development