IMAGE

Fig. 9.

ID
ZDB-IMAGE-231220-50
Source
Figures for Square et al., 2023
Image
Figure Caption

Fig. 9.

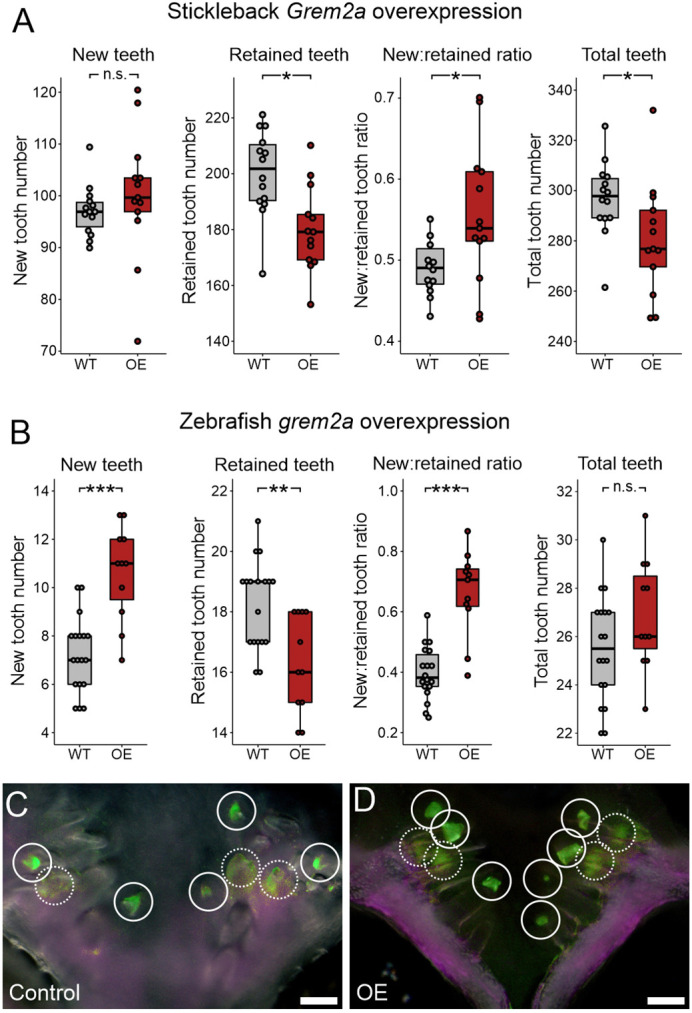
Effects of Grem2a overexpression in stickleback and zebrafish. All P-values are derived from Wilcoxon Rank-Sum tests, adjusted for multiple hypothesis testing. (A) In sticklebacks, significant decrease in the number of retained teeth (P=0.018), a significant increase in the new:retained ratio (P=0.039) and total teeth (P=0.029), but no significant changes to new teeth (P=0.11) were observed (n=14 control, 13 OE fish). (B) In zebrafish, significant increases in the number of new teeth (P=0.00062) and the new:retained ratio (P=0.00053), a significant decrease in retained teeth (P=0.0062), and no significant change in total teeth (P=0.14) was observed (n=18 control, 11 OE fish). (C,D) Overlay images of zebrafish ventral tooth plates showing Alizarin Red and calcein signal in control (B) and OE (C) fish. White circles indicate new teeth (solid circles mark superficial teeth, and dotted circles mark teeth deep in the tooth field that are occluded by erupted teeth). Boxes represent the 25th-75th percentiles, the median is shown as a black bar, and whiskers represent those data within 1.5× the interquartile range above and below the 75th and 25th percentiles, respectively. *P<0.05, **P<0.01, ***P<0.001. n.s., not significant. Scale bars: 100 μm.

Acknowledgments
This image is the copyrighted work of the attributed author or publisher, and ZFIN has permission only to display this image to its users. Additional permissions should be obtained from the applicable author or publisher of the image. Full text @ Development