
- Title
-
Glycosylated queuosines in tRNAs optimize translational rate and post-embryonic growth
- Authors
- Zhao, X., Ma, D., Ishiguro, K., Saito, H., Akichika, S., Matsuzawa, I., Mito, M., Irie, T., Ishibashi, K., Wakabayashi, K., Sakaguchi, Y., Yokoyama, T., Mishima, Y., Shirouzu, M., Iwasaki, S., Suzuki, T., Suzuki, T.
- Source
- Full text @ Cell
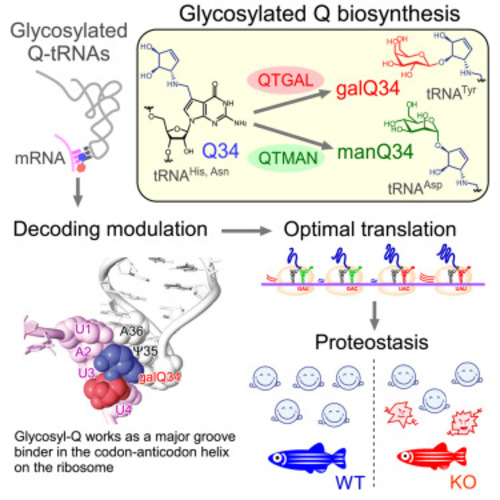
Glycosyl queuosines in mammalian cytoplasmic tRNAs (A and B) Secondary structures of human tRNATyr (A) and tRNAAsp (B) harboring galQ and manQ at position 34, respectively. The Q side chain is colored blue, and galactose and mannose moieties are colored red and green, respectively. (C) Biogenesis of Q-tRNAs and glycosyl-Q-tRNAs in eukaryotes. tRNAs for Tyr, Asp, His, and Asn are modified by the QTRT1/QTRT2 heterodimer to form Q34. Q34 of tRNATyr is further galactosylated to form galQ34 by QTGAL in the presence of UDP-galactose (UDP-gal), while Q34 of tRNAAsp is further mannnosylated to form manQ34 by QTMAN in the presence of GDP-mannose (GDP-man). (D and F) Detection of QTGAL (D) or QTMAN (F) activity in rat liver lysates. Extracted-ion chromatograms (XICs) of Q-containing fragments (upper) and galQ-(D) or manQ-(F) containing fragments (lower) of human tRNATyr (D) or E. coli tRNAAsp (F) digested by RNase T1 in the presence of crude lysate with or without UDP-gal (D) or GDP-man (F). (E and G) CID spectrum of galQ- (E) or manQ- (G) containing fragment. c and y series product ions are assigned. >p, 2′, 3′-cyclic phosphate. m2A, 2-methyladenosine. See also Figure S1, Figure S10, Figure S11, Figure S12. |
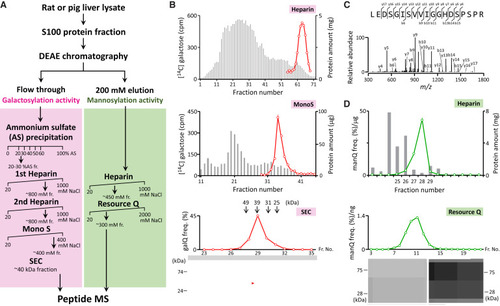
Activity-based identification of Q-glycosylating enzymes (A) Fractionation scheme of QTGAL (left) and QTMAN (right). (B) Fractionation of rat QTGAL activity by heparin chromatography (top), Mono S (middle), and SEC (bottom). Gray bars indicate protein amount (mg). Red plots show QTGAL activity measured by radioactivity of 14C-galactose incorporation (heparin and Mono S) or by LC/MS of galQ nucleoside (SEC). Molecular masses of size markers are indicated above the SEC profile. Proteins in the SEC fractions are resolved by SDS-PAGE. The band indicated by a red arrowhead was assigned to QTGAL (B3GNTL1). (C) CID spectrum of a tryptic fragment of the excised protein band. b and y series product ions are assigned to the tryptic peptide of rat B3GNTL1. (D) Fractionation of pig QTMAN activity by heparin and Resource Q chromatographies. Gray bars indicate protein amount (mg). Green plots show QTMAN activity measured by LC/MS of manQ nucleoside. Proteins fractionated by Resource Q are resolved by SDS-PAGE. See also Figures S10 and S11. |
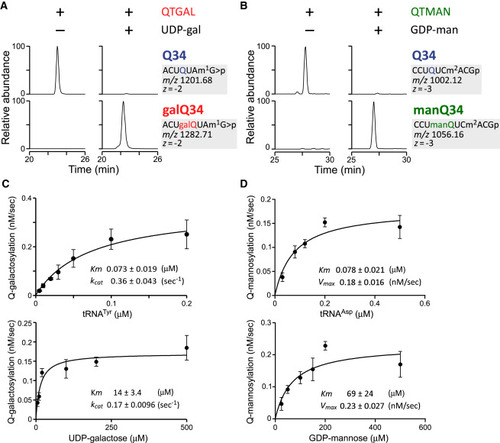
In vitro reconstitution and kinetic analysis of Q-glycosylation (A) In vitro reconstitution of galQ34 in human tRNATyr with recombinant QTGAL in the presence (+) or absence (−) of UDP-gal. (B) In vitro reconstitution of manQ34 in E. coli tRNAAsp with recombinant QTMAN in the presence (+) or absence (−) of GDP-man. (C and D) Kinetic analyses of galQ34 (C) or manQ34 (D) formation by recombinant QTGAL or QTMAN with different concentrations of human tRNATyr or E. coli tRNAAsp (upper) and UDP-gal or GDP-man (lower), respectively. The initial velocity of galQ34 or manQ34 formation (nM/s) is plotted as the mean ± standard deviation (SD; n = 3). Data are fitted to the Michaelis-Menten equation to yield Km and Vmax values (inset). See also Figures S1, S10, and S11. |
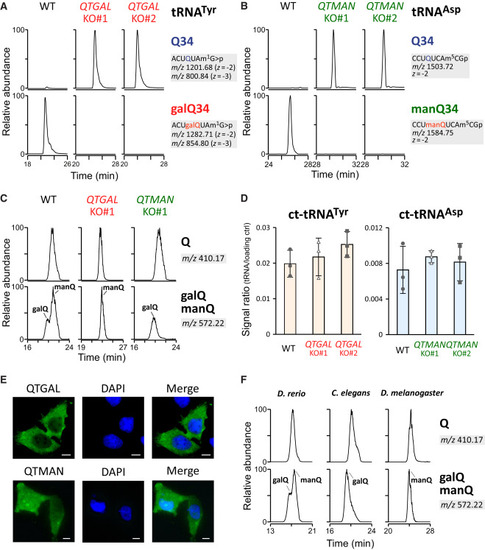
Characterization of QTGAL and QTMAN in human culture cells (A and B) Complete loss of galQ (A) or manQ (B) in cytoplasmic tRNATyr or tRNAAsp isolated from QTGAL KO or QTMAN KO cells, respectively. XICs show Q-containing fragments (top) and galQ- or manQ-containing fragments (bottom) of tRNATyr or tRNAAsp isolated from WT, KO#1, and KO#2. Judging from the peak intensities, WT tRNATyr has 98% galQ34 and 2% Q34, while WT tRNAAsp is fully modified by manQ34. (C) Loss of galQ and manQ in QTGAL KO and QTMAN KO cells. XICs show proton adducts of Q (upper) and galQ or manQ (lower) in total nucleosides from QTGAL KO#1 or QTMAN KO#1. (D) Northern blotting of cytoplasmic tRNAs in the KO cells. Relative steady-state levels of cytoplasmic tRNATyr (left) and tRNAAsp (right) in WT HEK293T, QTGAL KO cells, or QTMAN KO cells, normalized against a loading control (5S rRNA). Each data point plotted on the bar graph shows mean ± SD (n = 3). (E) Subcellular localization of QTGAL and QTMAN. Immunofluorescence detection of the N-terminal FLAG-tagged QTGAL (upper) and QTMAN (lower) transiently expressed in HeLa cells. The green signal shows immunofluorescence detected by anti-FLAG antibody (left). Nuclei (blue) are stained by DAPI (middle). Merged images are shown on the right. Scale bars, 10 μm. (F) Nucleoside analysis of Q, galQ, and manQ in total RNA from D. rerio, C. elegans, and D. melanogaster. See also Figure S2. |
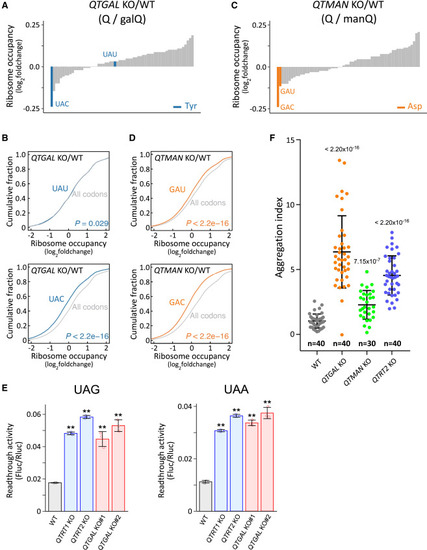
Q-glycosylations regulate codon-specific translation and proteostasis (A and C) Fold-changes in ribosome occupancy at the A-site codon of QTGAL KO#1 (A) and QTMAN KO#1 (C), compared with WT HEK293T cells. Tyr and Asp codons are colored blue (A) and orange (C), respectively. Other codons are colored gray. (B and D) Cumulative plot of fold-changes in A-site ribosome occupancy of codons for Tyr (B, blue), Asp (D, orange), and others (gray) in QTGAL KO#1 (B) and QTMAN KO#1 (D), compared with WT HEK293T cells. p values were calculated by Mann-Whitney U test. (E) Dual luciferase reporter assay to examine readthrough of UAG (left) and UAA (right) codons in the respective KO cells. Each data point plotted on the bar graph shows mean ± SD (n = 3). ∗∗p < 0.01 by Student’s t test. (F) Measurement of cellular proteostasis in QTGAL KO and QTMAN KO using the EGFP-tagged firefly luciferase (Fluc) variant (R188Q). Aggregation index was calculated from the reporter protein aggregates divided by the area of EGFP fluorescence in microscopy images. Horizontal lines in the scattered dot plot represent mean ± SD. p values were calculated by Mann-Whitney U test. Datasets for WT and QTRT2 KO were referred to our previous study.26 See also Figure S3. |
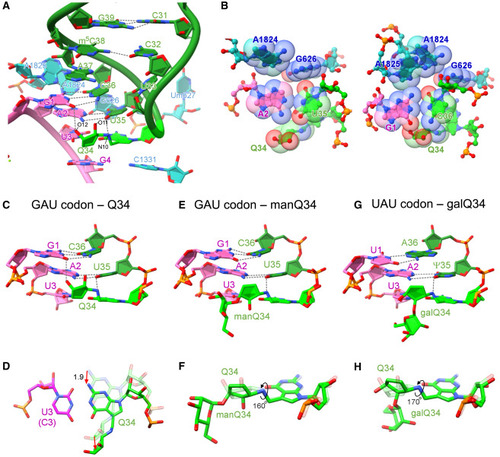
Structural analysis of decoding modulation mediated by Q-glycosylation (A) Cryo-EM structure of the codon-anticodon interaction at the A-site of human 80S ribosome with human tRNAAsp bearing Q34 (green) and GAU codon (magenta) (PDB: 8JDJ ). 18S rRNA is colored cyan. H-bonds are shown as dotted lines. (B) Sphere representations of the codon-anticodon interaction (Q34 and GAU codon) viewed from the second base pair (left) and the first base pair (right). The van der Waals radius of the base atom is depicted in sphere representation (PDB: 8JDJ ). (C, E, and G) Cryo-EM structures of the codon-anticodon interaction at the A-site of human 80S ribosome with human tRNAAsp bearing Q34 (green) and GAU codon (magenta) (PDB: 8JDJ ) (C), human tRNAAsp bearing manQ34 (green) and GAU codon (magenta)(PDB: 8JDK) (E), and human tRNATyr bearing galQ34 (green) and UAU codon (magenta) (PDB: 8JDM ) (G), viewed from the major groove side. H-bonds are shown as dotted lines. (D) Structural alteration between Q34-C3 and Q34-U3 pairs. The Q34-C3 pair is superimposed on Q34-U3 by aligning C3 and U3. N2 and N10 of Q34 are shifted by 1.9 Å. The cyclopentene moiety of Q34 moves away from the major groove of the codon-anticodon helix. (F and H) Rotation of the cyclopentene moiety caused by glycosylation of Q34. Q34 (PDB: 8JDJ ) is aligned with manQ34 (PDB: 8JDK) (F) or galQ34 (PDB: 8JDM ) (H). Compared with Q34, the cyclopentene moieties of manQ34 and galQ34 are rotated by 160° and 170° in clockwise direction, respectively. See also Figures S4, S5, S6, S7, and S8 and Table S2. |
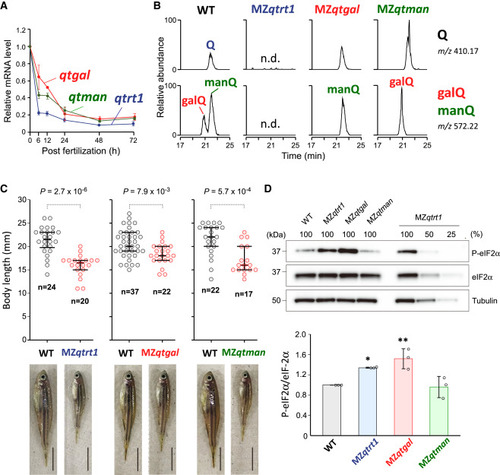
Physiological impact of Q-glycosylation in zebrafish (A) Relative mRNA levels of qtrt1 (blue), qtgal (red), and qtman (green) after fertilization. Each data point shows mean ± SD (n = 3). (B) Nucleoside analysis of Q, galQ, and manQ in total RNA from WT and MZ mutant fish. XICs show proton adducts of Q (upper) and galQ or manQ (lower) in total nucleosides from WT (leftmost panels), MZqtrt1 (left), MZqtgal (right), and MZqtman (rightmost panels). n.d., not detected. (C) Distribution of the body length of MZ mutant fish at the 10th week after fertilization. p values were calculated by Mann-Whitney U test (two-tailed, p < 0.05). Representative images of fish with median length are shown. Scale bars, 5 mm. (D) Western blotting of phosphorylated eIF2α of a series of zebrafish strains. Band intensities of phospho-eIF2α were normalized by those of eIF2α. Each data point plotted on the bar graph shows mean ± SD (n = 3). ∗p < 0.05 and ∗∗p < 0.01 by Dunnett’s t test. See also Figure S9. |
|
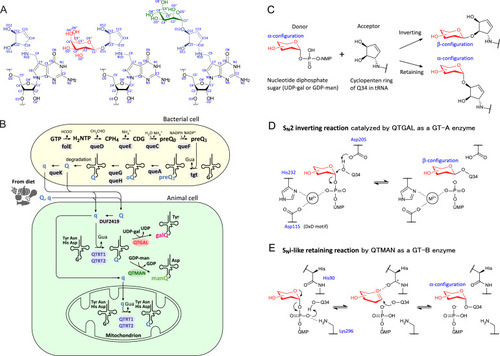
Biogenesis of Q derivatives and reaction mechanisms of Q-glycosylations, related to Figures 1, 3, and 6 (A) Chemical structures with atom numbering of Q (left), galQ (middle), and manQ (right). (B) Queuosine biosynthesis in bacteria. A queuosine (Q) precursor base, 7-cyano-7-deazaguanine (preQ1), is generated from GTP through five step reaction; preQ1 is then inserted at the first position of the tRNA anticodon via a base-exchanging reaction catalyzed by tRNA guanine transglycosylase (TGT), followed by two steps to complete Q biogenesis on tRNA. Q or queuine (q) originating from Q-tRNA degradation or the diet is incorporated into animal cells. The DUF2419 protein (C9orf64 in human) is believed to release q from Q in the cytoplasm of animal cells. The QTRT1/QTRT2 heterodimer, a eukaryotic TGT, inserts q into cytoplasmic tRNAs for Tyr, Asp, His, and Asn. QTGAL galactosylates Q34 using UDP-gal to form galQ34 of tRNATyr. QTMAN mannosylates Q34 using GDP-man to form manQ34 of tRNAAsp. The QTRT1/QTRT2 heterodimer is also responsible for Q34 formation in mitochondrial tRNAs for Tyr, Asp, His, and Asn. 7-deazaguanosine derivatives are colored blue. GTP, guanosine triphosphate; DH2NTP, 7,8-dihydroneopterine triphosphate; CPH4, 6-carboxy-5,6,7,8-tetrahydropterin; CDG, 7-carboxy-7-deazaguanine; preQ0, 7-cyano-7-deazaguanine; oQ, epoxyqueuosine; Gua, guanosine. (C) Classification of Q-glycosylation as inverting or retaining based on the anomeric configuration of the sugar donor in the products. (D) Possible mechanism of the SN2 inverting reaction catalyzed by QTGAL. The amino acid residue numbers are from human QTGAL. (E) Possible mechanism of the SNi-like retaining reaction catalyzed by QTMAN. The amino acid residue numbers are from human QTMAN. |
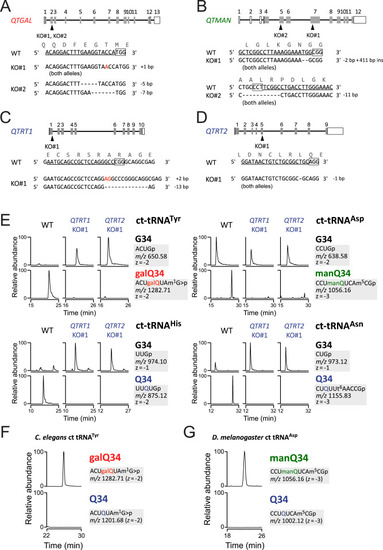
Genetic characterization of Q and Q-glycosylation in human cells, related to Figure 4 (A–D) Schematic diagram of human QTRT1 (A), QTRT2 (B), QTGAL (C), and QTMAN (D) genes with sgRNA sequences. Shaded and open boxes indicate coding and untranslated regions of the genes, respectively. Lines indicate introns. Mutation sites in sgRNA-targeted exons are indicated by arrowheads. The sgRNA-targeted sequences are underlined and protospacer adjacent motif (PAM) sequences are boxed. Nucleotide insertion and deletion are indicated by red letters and dashed lines, respectively. (E) XICs showing the RNase T1-digested fragments containing position 34 of cytoplasmic tRNAs for Tyr, Asp, His, and Asn isolated from WT HEK293T (left), QTRT1 KO (middle), and QTRT2 KO (right). Signal intensities were normalized against a unique internal fragment of respective tRNAs. t6A, N6-threonylcarbamoyladenosine. (F and G) Analyses of glycosyl-Qs in other animals. XICs showing the galQ-containing fragment of C. elegans cytoplasmic tRNATyr (F), and the manQ-containing fragment of D. melanogaster cytoplasmic tRNAAsp (G). |
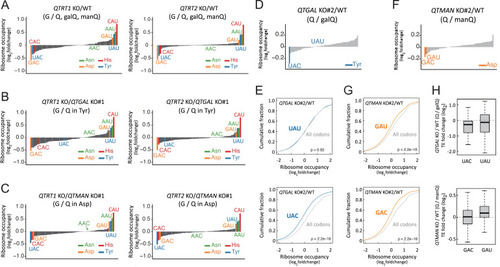
Codon-specific translational regulation by Q and Q-glycosylation, related to Figure 5 (A–C) Fold-changes in ribosome occupancy at the A-site codon of QTRT1 KO (left) and QTRT2 KO (right) compared with WT HEK293T (A), QTGAL KO (B), and QTMAN KO (C) cell lines. Tyr, Asp, His, and Asn codons are colored blue, orange, red, and green, respectively. (D and F) Fold change of A-site ribosome occupancy at codons in QTGAL KO#2 (D) and QTMAN KO#2 (F) compared with WT HEK293T cell lines. Tyr and Asp codons are colored blue (D) and orange (F), respectively. Other codons are colored gray. (E and G) Cumulative plot of the A-site ribosome occupancy fold change at codons for Tyr (blue), Asp (orange) and all codons (gray) in QTGAL KO#2 (E) and QTMAN KO#2 (G) compared with WT HEK293T cells. p values were calculated by Mann-Whitney U test. (H) TE fold change (log2) of QTGAL KO versus WT (Q/GalQ) for UAC- and UAU-enriched mRNAs (upper) and QTMAN KO versus WT (Q/ManQ) for GAC- and GAU-enriched mRNAs (lower). mRNAs which possess the indicated codons more than 8% are considered. |
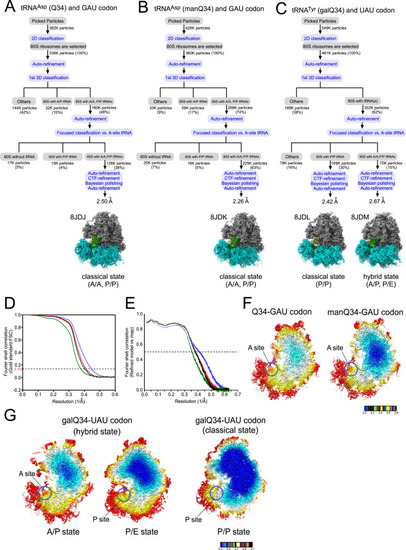
Image processing procedures for cryo-EM of human 80S ribosomes, related to Figure 6 Image processing of human 80S ribosomes complexed with Q-tRNAs at both A- and P-sites. (A–C) (A) Human tRNAAsp bearing Q34 and the GAU codon at the A- and P-sites (PDB: 8JDJ , EMDB: EMD-36178), (B) Human tRNAAsp bearing manQ34 and the GAU codon at the A- and P-sites (PDB: 8JDK, EMDB: EMD-36179), (C) human tRNATyr bearing galQ34 and the UAU codon at the P-site in the classical state (PDB: 8JDL, EMDB: EMD-36180), and at the A- and P-sites in the hybrid state (PDB: 8JDM, EMDB : EMD-36181). The subgroup “others” includes A-site vacant 80S and low-resolution particles. (D and E) Gold standard Fourier shell correlation (FSC) curves (D) and refined model versus map FSC curves (E) of cryo-EM models. Black, tRNAAsp (Q34) with the GAU codon (PDB: 8JDJ , EMDB: EMD-36178), blue, tRNAAsp (manQ34) with the GAU codon (PDB: 8JDK, EMDB: EMD-36179), Red, tRNATyr (galQ34) with the UAU codon in the classical state (PDB: 8JDL, EMDB: EMD-36180), Green, tRNATyr (galQ34) with the UAU codon in the hybrid state (PDB: 8JDM, EMDB : EMD-36181). (F) Color-coded local resolution distribution of cryo-EM maps of human 80S ribosome complexed with tRNAAsp bearing Q34 (left) and manQ34 (right). Red circles indicate the A-sites. (G) Color-coded local resolution distribution of cryo-EM maps of human 80S ribosome complexed with tRNATyr bearing galQ34 in the hybrid state (left and middle) and in the classical state (right). Red circles indicate the P- and A-sites. |
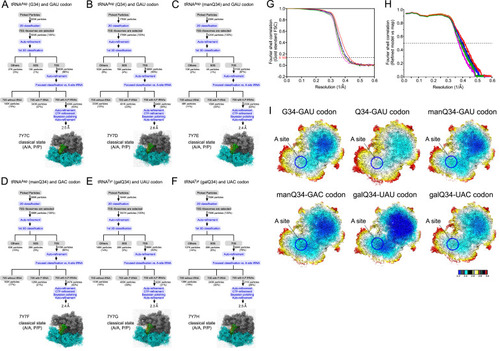
Image processing procedures for cryo-EM of E. coli 70S ribosomes, related to Figure 6 Image processing of E. coli 70S ribosomes complexed with tRNAiMet at P-site Q-tRNAs at the A-site. (A–F) (A) Human tRNAAsp bearing G34 and the GAU codon at the A-site (PDB: 7Y7C , EMDB: EMD-33660), (B) human tRNAAsp bearing Q34 and the GAU codon at the A-site (PDB: 7Y7D, EMDB: EMD-33661), (C) human tRNAAsp bearing manQ34 and the GAU codon at the A-site (PDB: 7Y7E, EMDB: EMD-33662), (D) human tRNAAsp bearing manQ34 and the GAC codon at the A-site (PDB: 7Y7F, EMDB: EMD-33663), (E) human tRNATyr bearing galQ34 and the UAU codon at the A-site (PDB: 7Y7G, EMDB: EMD-33664), (F) human tRNATyr bearing galQ34 and the UAC codon at the A-site (PDB: 7Y7H, EMDB : EMD-33665). The subgroup others includes A-site vacant 70S and low-resolution particles. (G and H) Gold standard FSC curves (G) and refined model versus map FSC curves (H) of cryo-EM models. Black, tRNAAsp (manQ34) with the GAU codon (PDB: 7Y7E , EMDB: EMD-33662), blue, tRNAAsp (manQ34) with the GAC codon (PDB: 7Y7F, EMDB: EMD-33663), red, tRNATyr (galQ34) with the UAU codon (PDB: 7Y7G, EMDB: EMD-33664), green, tRNATyr (galQ34) with the UAC codon (PDB: 7Y7H, EMDB: EMD-33665), orange, tRNAAsp (G34) with the GAU codon (PDB: 7Y7C, EMDB: EMD-33660), purple, tRNAAsp (Q34) with the GAU codon (PDB: 7Y7D, EMDB : EMD-33661). (I) Color-coded local resolution distribution of cryo-EM map for each ribosome complex as indicated. Blue circles indicate the A-sites. |
Cryo-EM maps and models of codon-anticodon interactions on the ribosome complexes, related to Figure 6 (A and B) Cryo-EM structures of codon-anticodon interactions at the A-site of human 80S ribosomes bound by human tRNAAsp bearing manQ34 (green) and GAU codon (magenta) (PDB: 8JDK ) (A), and human tRNATyr bearing galQ34 (green) and UAU codon (magenta) (PDB: 8JDM ) (B). 18S rRNA is colored cyan. H-bonds are shown as dotted lines. (C–F) Cryo-EM maps and models show base pairing between the 3rd position of the codon and the wobble position of the anticodon at the P- and A-sites of human 80S ribosomes. Hydrogen bonds are depicted as dotted lines. Unpostprocessed and postprocessed maps are depicted in purple surface and gray mesh, respectively. (C) PDB: 8JDJ with the unpostprocessed map at level 0.014, and the postprocessed map at level 0.02 (EMDB: EMD-36178). (D) PDB: 8JDK with the unpostprocessed map at level 0.0129, and the postprocessed map at level 0.018 (EMDB: EMD-36179). (E) PDB: 8JDL with the unpostprocessed map at level 0.0109, and the postprocessed map at level 0.018 (EMDB: EMD-36180). (F) PDB: 8JDM with the unpostprocessed map at level 0.012, and the postprocessed map at level 0.018 (EMDB: EMD-35161). (G–L) Cryo-EM maps and models show base pairing between the 3rd position of the codon and the wobble position of the anticodon at the A-site of E. coli 70S ribosomes. Hydrogen bonds are depicted as dotted lines. Unpostprocessed and postprocessed maps are depicted in purple surface and gray mesh, respectively. (G) PDB: 7Y7C with the unpostprocessed map at level 0.0071, and the postprocessed map at level 0.0219 (EMDB: EMD-33660). (H) PDB: 7Y7D with the unpostprocessed map at level 0.0058, and the postprocessed map at level 0.0225 (EMDB: EMD-33661). (I) PDB: 7Y7E with the unpostprocessed map at level 0.0075, and the postprocessed map at level 0.0298 (EMDB: EMD-33662). (J) PDB: 7Y7F with the unpostprocessed map at level 0.0075, and the postprocessed map at level 0.0278 (EMDB: EMD-33663). (K) PDB: 7Y7G with the unpostprocessed map at level 0.0072, and the postprocessed map at level 0.0308 (EMDB: EMD-33664). (L) PDB: 7Y7H with the unpostprocessed map at level 0.0075, and the postprocessed map at level 0.0255 (EMDB: EMD-33665). |
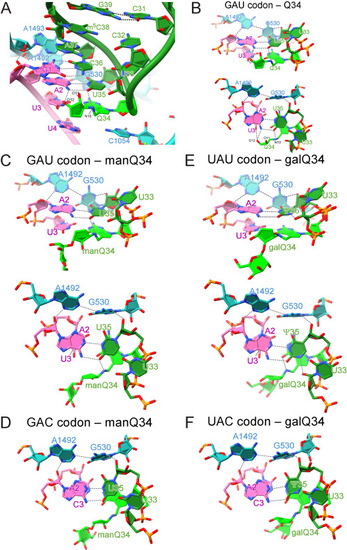
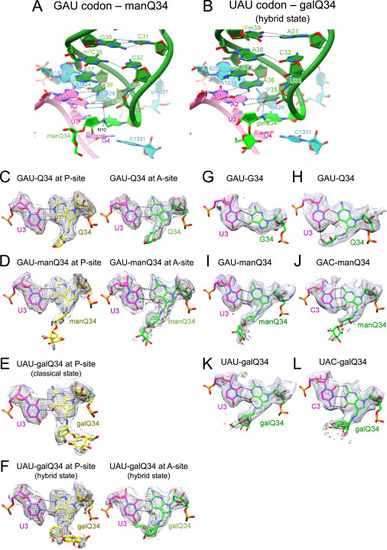
Cryo-EM analyses of codon-anticodon interactions of human tRNAs at the A-site of E. coli 70S ribosome complexes, related to Figure 6 (A) Close-up view of the codon-anticodon interaction at the A-site of the ribosome with human tRNAAsp bearing Q34 (green) and GAU codon (magenta) (PDB: 7Y7D ). 16S rRNA is colored cyan. Hydrogen bonds are shown as dotted lines. (B, C, and E) Cryo-EM structure of the codon-anticodon interaction at the A-site between human tRNAAsp bearing Q34 (green) and the GAU codon (PDB: 7Y7D ) (B), human tRNAAsp bearing manQ34 (green) and the GAU codon (PDB: 7Y7E) (C), and human tRNATyr bearing galQ34 (green) and the UAU codon (PDB: 7Y7G ) (E), viewed from the major groove side (upper) and from the upper side (lower). Hydrogen bonds are shown as dotted lines. (D and F) Cryo-EM structure of the codon-anticodon interaction at the A-site between human tRNAAsp bearing manQ34 (green) and the GAC codon (PDB: 7Y7F ) (D), and human tRNATyr bearing galQ34 (green) and the UAC codon (PDB: 7Y7H) (F), viewed from the upper side. Hydrogen bonds are shown as dotted lines. |
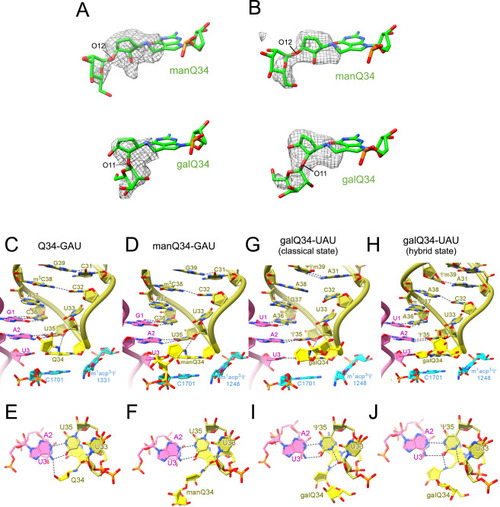
Cryo-EM densities of the glycosyl-Qs and codon-anticodon interactions of human tRNAs at the P-site, related to Figure 6 (A) Unpostprocessed maps (gray mesh) of manQ (level 0.0104, EMDB: EMD-36179) and galQ (level 0.012, EMDB: EMD-36181) are superimposed on each model structure (manQ: 8JDK, galQ: 8JDM) in human 80S ribosome. (B) Unpostprocessed maps (gray mesh) of manQ (level 0.0075, EMDB: EMD-33662) and galQ (level 0.0072, EMDB: EMD-33664) are superimposed on each model structure (manQ: 7Y7E, galQ: 7Y7G) in E. coli 70S ribosome. (C–J) Close-up views (C, D, G, and H) and upper side views (E, F, I, and J) of the codon-anticodon interaction at the P-site of the ribosome with human tRNAAsp bearing Q34 (yellow) and GAU codon (magenta) (PDB: 8JDJ ) (C and E), human tRNAAsp bearing manQ34 (yellow) and GAU codon (magenta) (PDB: 8JDK) (D and F), human tRNATyr bearing galQ34 (yellow) and UAU codon (magenta) in the classical state (PDB: 8JDL) (G and I), and in the hybrid state (PDB: 8JDM) (H and J). 18S rRNA is colored cyan. Hydrogen bonds are shown as dotted lines. |
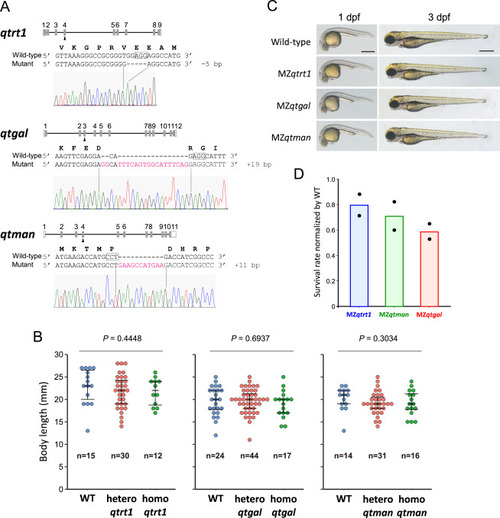
Characterization of zebrafish mutants for Q and Q-glycosylation, related to Figure 7 (A) Schematic diagram of zebrafish qtrt1, qtgal, and qtman and their mutations used in this study. For each gene, the sgRNA-targeted exon is indicated by arrowheads. Sequences of WT and genome-edited alleles are shown. Electropherogram of Sanger sequences of the mutated alleles are shown below. (B) Distribution of the body length of hetero and homo mutant fish at the 10th week after fertilization. p values were calculated by Kruskal-Wallis test (two-tailed, p < 0.05). (C) Representative images of WT and MZ mutant embryos at 1 day post-fertilization (dpf) (pre-hatching) and 3 dpf (post-hatching) stages. Scale bars, 500 μm. (D) Survival rates of MZ fish relative to wild type at the 10th week after fertilization. Bars are average values of two independent experiments. |
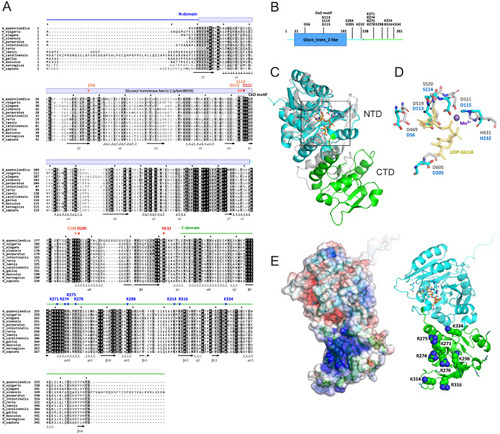
Sequence alignment and structural characterization of human QTGAL, related to Figure 3 (A) Multiple alignment of 13 QTGAL orthologs by multiple alignment using fast Fourier transform (MAFFT) [S1]. Conserved domains are indicated by colored bars and lines above the alignment. Secondary structures defined from a predicted structure of human QTGAL are indicated below the alignment. Residues predicted to be essential for enzymatic activity are indicated by arrowheads: red, catalytic residues; orange, conserved residues of the catalytic center; blue, basic residues that may interact with the substrate tRNA. (B) Schematic domains of human QTGAL. Color coding is coordinated with (A). Conserved residues involved in catalytic activity or tRNA recognition (shown in A) are indicated. (C) Overall structure of human QTGAL predicted by AlphaFold (https://alphafold.ebi.ac.uk/entry/Q67FW5 ). The N-terminal domain (NTD) and C-terminal domain (CTD) are colored cyan and green, respectively. NTD of QTGAL is superimposed on CTD of K4CP (gray, 2z86 chain D). The catalytic center located in NTD is boxed. (D) Superimposition of the catalytic center of QTGAL and K4CP with a divalent manganese ion and UDP-GlcUA as a sugar donor. (E) (Left) Electrostatic surface potential generated by eF-surf (https://pdbj.org/eF-surf/top.do ) [S2] overlayed on a cartoon model of the QTGAL structure. Positively and negatively charged areas are colored blue and red, respectively. (Right) Conserved positively charged residues (shown in A) are labeled and shown as ball-and-stick models. |
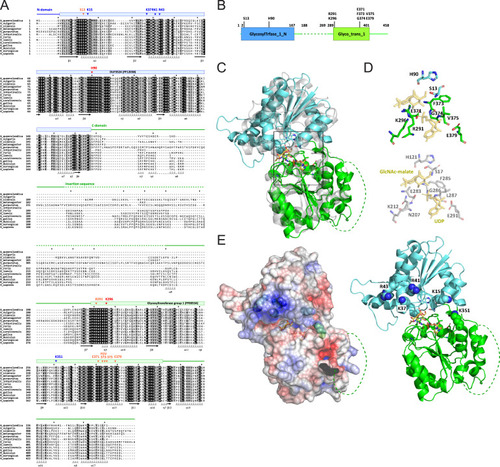
Sequence alignment and structural characterization of human QTMAN, related to Figure 3 (A) Multiple alignment of 13 QTMAN orthologs by MAFFT [S1]. Conserved domains are shown by colored bars and lines above the alignment. Secondary structures defined from a predicted structure of human QTMAN are indicated below the alignment. Residues predicted to be essential for enzymatic activity of QTMAN are indicated by arrowheads: red, catalytic residues; orange, conserved residues of the catalytic center; blue, basic residues that may recognize the substrate tRNA. (B) Schematic diagram of the domains of human QTMAN. Color coding is coordinated with (A). Conserved residues involved in catalytic activity or tRNA recognition (shown in A) are indicated. (C) Overall structure of human QTMAN predicted by AlphaFold (https://alphafold.ebi.ac.uk/entry/Q4AE62 ) superimposed on GshA (gray, 5d00 chain B). The N-terminal domain (NTD) and C-terminal domain (CTD) are colored cyan and green, respectively. The catalytic center located in the cleft of NTD and CTD is boxed. The insertion sequence (shown in A) is shown as a dotted line. (D) Catalytic center of QTMAN (upper) and GshA (lower) with UDP and GlcNAc-malate as a post-glycosyl transfer state. (E) (Left) Electrostatic surface potential generated by eF-surf (https://pdbj.org/eF-surf/top.do ) [S2] overlayed on a cartoon model of the QTMAN structure. Positively and negatively charged areas are colored blue and red, respectively. (Right) Conserved positively charged residues (shown in A) are labeled and shown as ball-and-stick models. |
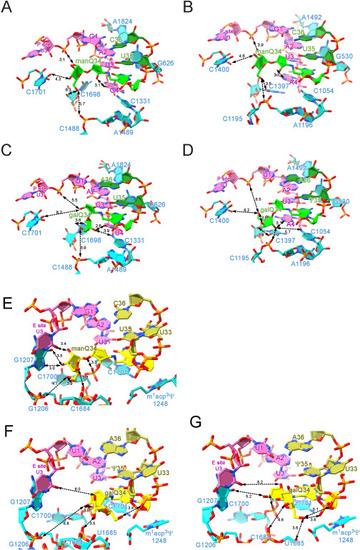
Local environment of sugar moieties of glycosyl-Q on the ribosome, related to Figure 6 (A–D) Models of glycosyl-Qs at the A-site. Local environment of sugar moieties of manQ34 in the human 80S ribosome (PDB: 8JDK ) (A) and in the E. coli 70S ribosome (PDB: 7Y7E) (B), and galQ34 in the human 80S ribosome (PDB: 8JDM) (C) and in the E. coli 70S ribosome (PDB: 7Y7G ) (D). (E–G) Models of glycosyl-Qs at the P-site of human 80S ribosome. Local environment of sugar moieties of manQ34 (PDB: 8JDK ) (E) and galQ34 in the classical state (PDB: 8JDL) (F) and in the hybrid state (PDB: 8JDM) (G) at the P-site. Distances between two atoms are depicted by dotted arrows. |
Reprinted from Cell, 186(25), Zhao, X., Ma, D., Ishiguro, K., Saito, H., Akichika, S., Matsuzawa, I., Mito, M., Irie, T., Ishibashi, K., Wakabayashi, K., Sakaguchi, Y., Yokoyama, T., Mishima, Y., Shirouzu, M., Iwasaki, S., Suzuki, T., Suzuki, T., Glycosylated queuosines in tRNAs optimize translational rate and post-embryonic growth, 5517-5535.e24, Copyright (2023) with permission from Elsevier. Full text @ Cell