
Fig. 7
- ID
- ZDB-FIG-240206-7
- Publication
- Zhao et al., 2023 - Glycosylated queuosines in tRNAs optimize translational rate and post-embryonic growth
- Other Figures
- All Figure Page
- Back to All Figure Page
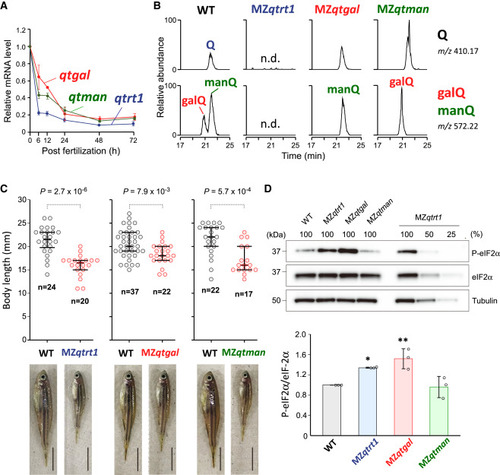
Physiological impact of Q-glycosylation in zebrafish (A) Relative mRNA levels of qtrt1 (blue), qtgal (red), and qtman (green) after fertilization. Each data point shows mean ± SD (n = 3). (B) Nucleoside analysis of Q, galQ, and manQ in total RNA from WT and MZ mutant fish. XICs show proton adducts of Q (upper) and galQ or manQ (lower) in total nucleosides from WT (leftmost panels), MZqtrt1 (left), MZqtgal (right), and MZqtman (rightmost panels). n.d., not detected. (C) Distribution of the body length of MZ mutant fish at the 10th week after fertilization. p values were calculated by Mann-Whitney U test (two-tailed, p < 0.05). Representative images of fish with median length are shown. Scale bars, 5 mm. (D) Western blotting of phosphorylated eIF2α of a series of zebrafish strains. Band intensities of phospho-eIF2α were normalized by those of eIF2α. Each data point plotted on the bar graph shows mean ± SD (n = 3). ∗p < 0.05 and ∗∗p < 0.01 by Dunnett’s t test. See also Figure S9. |
Reprinted from Cell, 186(25), Zhao, X., Ma, D., Ishiguro, K., Saito, H., Akichika, S., Matsuzawa, I., Mito, M., Irie, T., Ishibashi, K., Wakabayashi, K., Sakaguchi, Y., Yokoyama, T., Mishima, Y., Shirouzu, M., Iwasaki, S., Suzuki, T., Suzuki, T., Glycosylated queuosines in tRNAs optimize translational rate and post-embryonic growth, 5517-5535.e24, Copyright (2023) with permission from Elsevier. Full text @ Cell