
Fig. S6
- ID
- ZDB-FIG-240206-13
- Publication
- Zhao et al., 2023 - Glycosylated queuosines in tRNAs optimize translational rate and post-embryonic growth
- Other Figures
- All Figure Page
- Back to All Figure Page
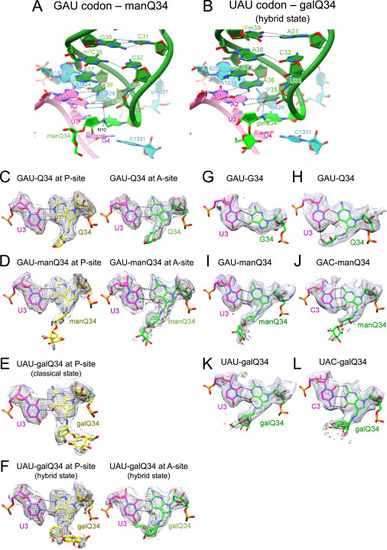
Cryo-EM maps and models of codon-anticodon interactions on the ribosome complexes, related to Figure 6 (A and B) Cryo-EM structures of codon-anticodon interactions at the A-site of human 80S ribosomes bound by human tRNAAsp bearing manQ34 (green) and GAU codon (magenta) (PDB: 8JDK ) (A), and human tRNATyr bearing galQ34 (green) and UAU codon (magenta) (PDB: 8JDM ) (B). 18S rRNA is colored cyan. H-bonds are shown as dotted lines. (C–F) Cryo-EM maps and models show base pairing between the 3rd position of the codon and the wobble position of the anticodon at the P- and A-sites of human 80S ribosomes. Hydrogen bonds are depicted as dotted lines. Unpostprocessed and postprocessed maps are depicted in purple surface and gray mesh, respectively. (C) PDB: 8JDJ with the unpostprocessed map at level 0.014, and the postprocessed map at level 0.02 (EMDB: EMD-36178). (D) PDB: 8JDK with the unpostprocessed map at level 0.0129, and the postprocessed map at level 0.018 (EMDB: EMD-36179). (E) PDB: 8JDL with the unpostprocessed map at level 0.0109, and the postprocessed map at level 0.018 (EMDB: EMD-36180). (F) PDB: 8JDM with the unpostprocessed map at level 0.012, and the postprocessed map at level 0.018 (EMDB: EMD-35161). (G–L) Cryo-EM maps and models show base pairing between the 3rd position of the codon and the wobble position of the anticodon at the A-site of E. coli 70S ribosomes. Hydrogen bonds are depicted as dotted lines. Unpostprocessed and postprocessed maps are depicted in purple surface and gray mesh, respectively. (G) PDB: 7Y7C with the unpostprocessed map at level 0.0071, and the postprocessed map at level 0.0219 (EMDB: EMD-33660). (H) PDB: 7Y7D with the unpostprocessed map at level 0.0058, and the postprocessed map at level 0.0225 (EMDB: EMD-33661). (I) PDB: 7Y7E with the unpostprocessed map at level 0.0075, and the postprocessed map at level 0.0298 (EMDB: EMD-33662). (J) PDB: 7Y7F with the unpostprocessed map at level 0.0075, and the postprocessed map at level 0.0278 (EMDB: EMD-33663). (K) PDB: 7Y7G with the unpostprocessed map at level 0.0072, and the postprocessed map at level 0.0308 (EMDB: EMD-33664). (L) PDB: 7Y7H with the unpostprocessed map at level 0.0075, and the postprocessed map at level 0.0255 (EMDB: EMD-33665). |
Reprinted from Cell, 186(25), Zhao, X., Ma, D., Ishiguro, K., Saito, H., Akichika, S., Matsuzawa, I., Mito, M., Irie, T., Ishibashi, K., Wakabayashi, K., Sakaguchi, Y., Yokoyama, T., Mishima, Y., Shirouzu, M., Iwasaki, S., Suzuki, T., Suzuki, T., Glycosylated queuosines in tRNAs optimize translational rate and post-embryonic growth, 5517-5535.e24, Copyright (2023) with permission from Elsevier. Full text @ Cell