
Fig. S9
- ID
- ZDB-FIG-240206-16
- Publication
- Zhao et al., 2023 - Glycosylated queuosines in tRNAs optimize translational rate and post-embryonic growth
- Other Figures
- All Figure Page
- Back to All Figure Page
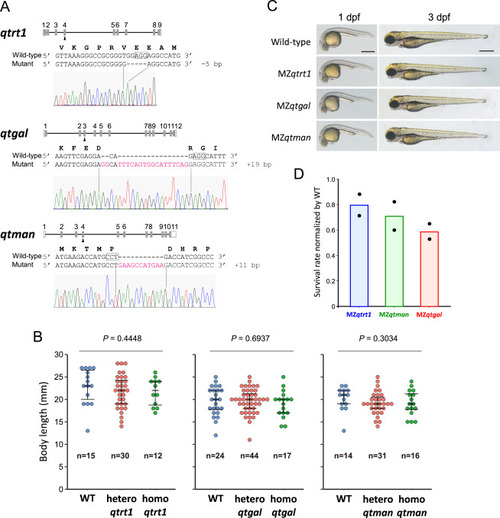
Characterization of zebrafish mutants for Q and Q-glycosylation, related to Figure 7 (A) Schematic diagram of zebrafish qtrt1, qtgal, and qtman and their mutations used in this study. For each gene, the sgRNA-targeted exon is indicated by arrowheads. Sequences of WT and genome-edited alleles are shown. Electropherogram of Sanger sequences of the mutated alleles are shown below. (B) Distribution of the body length of hetero and homo mutant fish at the 10th week after fertilization. p values were calculated by Kruskal-Wallis test (two-tailed, p < 0.05). (C) Representative images of WT and MZ mutant embryos at 1 day post-fertilization (dpf) (pre-hatching) and 3 dpf (post-hatching) stages. Scale bars, 500 μm. (D) Survival rates of MZ fish relative to wild type at the 10th week after fertilization. Bars are average values of two independent experiments. |
Reprinted from Cell, 186(25), Zhao, X., Ma, D., Ishiguro, K., Saito, H., Akichika, S., Matsuzawa, I., Mito, M., Irie, T., Ishibashi, K., Wakabayashi, K., Sakaguchi, Y., Yokoyama, T., Mishima, Y., Shirouzu, M., Iwasaki, S., Suzuki, T., Suzuki, T., Glycosylated queuosines in tRNAs optimize translational rate and post-embryonic growth, 5517-5535.e24, Copyright (2023) with permission from Elsevier. Full text @ Cell