
|
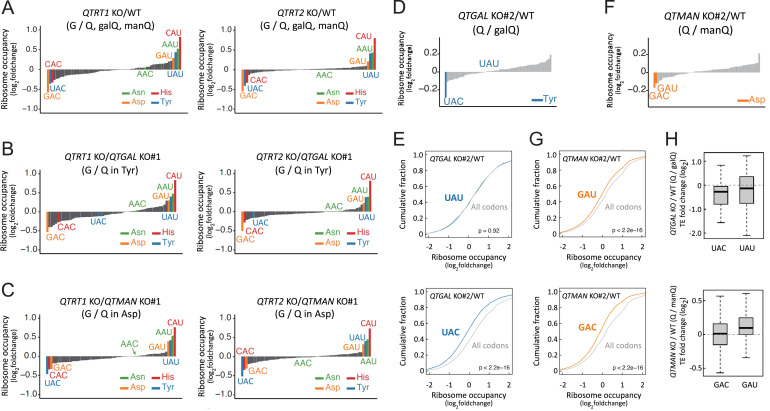
Fig. S3 Codon-specific translational regulation by Q and Q-glycosylation, related to Figure 5 (A–C) Fold-changes in ribosome occupancy at the A-site codon of QTRT1 KO (left) and QTRT2 KO (right) compared with WT HEK293T (A), QTGAL KO (B), and QTMAN KO (C) cell lines. Tyr, Asp, His, and Asn codons are colored blue, orange, red, and green, respectively. (D and F) Fold change of A-site ribosome occupancy at codons in QTGAL KO#2 (D) and QTMAN KO#2 (F) compared with WT HEK293T cell lines. Tyr and Asp codons are colored blue (D) and orange (F), respectively. Other codons are colored gray. (E and G) Cumulative plot of the A-site ribosome occupancy fold change at codons for Tyr (blue), Asp (orange) and all codons (gray) in QTGAL KO#2 (E) and QTMAN KO#2 (G) compared with WT HEK293T cells. p values were calculated by Mann-Whitney U test. (H) TE fold change (log2) of QTGAL KO versus WT (Q/GalQ) for UAC- and UAU-enriched mRNAs (upper) and QTMAN KO versus WT (Q/ManQ) for GAC- and GAU-enriched mRNAs (lower). mRNAs which possess the indicated codons more than 8% are considered.
Reprinted from Cell, 186(25), Zhao, X., Ma, D., Ishiguro, K., Saito, H., Akichika, S., Matsuzawa, I., Mito, M., Irie, T., Ishibashi, K., Wakabayashi, K., Sakaguchi, Y., Yokoyama, T., Mishima, Y., Shirouzu, M., Iwasaki, S., Suzuki, T., Suzuki, T., Glycosylated queuosines in tRNAs optimize translational rate and post-embryonic growth, 5517-5535.e24, Copyright (2023) with permission from Elsevier. Full text @ Cell