
- Title
-
Proenkephalin-A secreted by renal proximal tubules functions as a brake in kidney regeneration
- Authors
- Liu, C., Liu, X., He, Z., Zhang, J., Tan, X., Yang, W., Zhang, Y., Yu, T., Liao, S., Dai, L., Xu, Z., Li, F., Huang, Y., Zhao, J.
- Source
- Full text @ Nat. Commun.
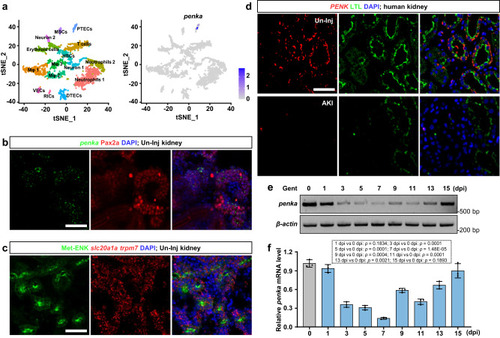
The expression patterns of zebrafish |
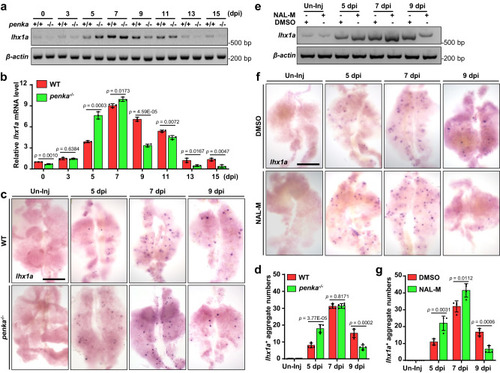
PENK-A deficiency accelerates kidney regeneration. |
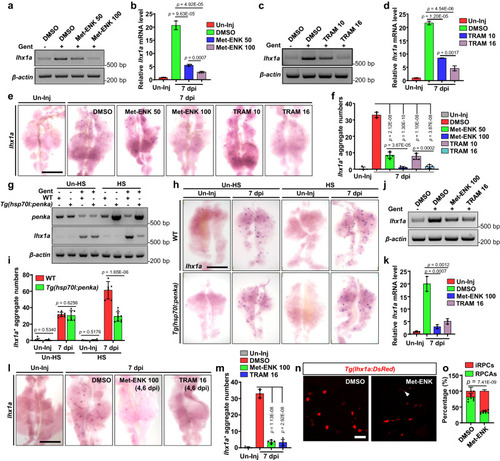
PENK-A acts as a brake in kidney regeneration. |
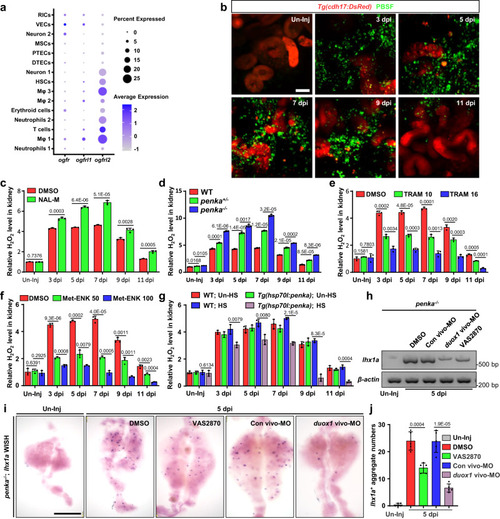
PENK-A regulates H2O2 production. |
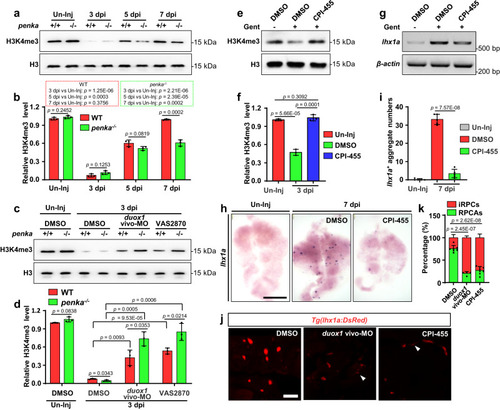
The PENK-A–H2O2 pathway affects the remodeling of global H3K4me3 in kidney cells. |
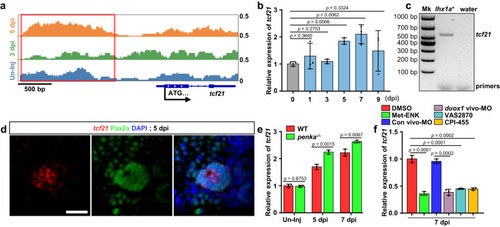
The PENK-A–H2O2 pathway regulates |
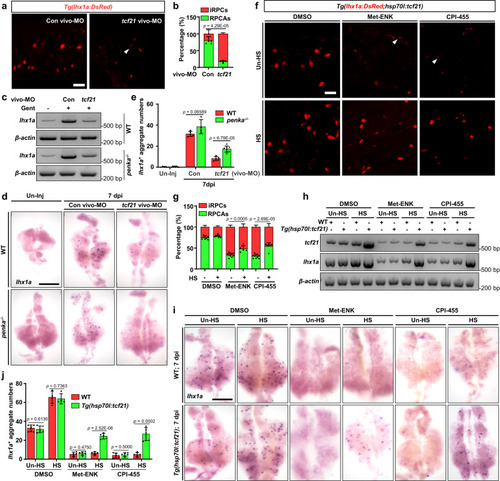
The PENK-A–H2O2 pathway regulates kidney regeneration through |
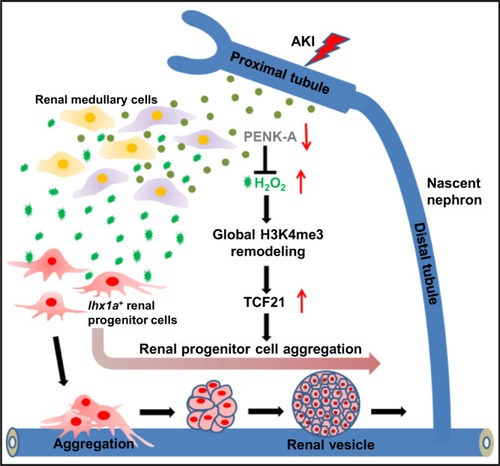
Graphical abstract summarizing the research findings. PTEC-expressed PENK-A levels decreased with the loss of PTs after AKI. This decrease triggered an increase in H2O2 production, resulting in the expansion of RPC aggregation. This process occurred by upregulating |