|
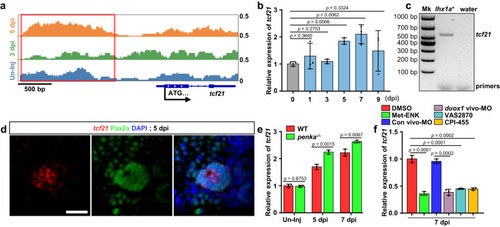
The PENK-A–H2O2 pathway regulates tcf21 expression through promoter H3K4me3 remodeling. a ChIP-seq analysis of the H3K4me3 pattern in the promoter region of tcf21. The H3K4me3 level upstream of the ATG start codon (red box) was decreased significantly at 3 dpi and increased at 5 dpi. b qRT-PCR analysis of tcf21 in zebrafish kidneys during AKI. The data were presented as the fold change relative to the 0 dpi group (n = 3 biological replications per group). c FACS coupled with RT-PCR analysis of tcf21 expression in lhx1a:DsRed-labeled RPCs at 5 dpi after AKI. Water was used as the RT-PCR negative control. Mk, Marker. d Confocal images revealed that the combination of tcf21 FISH with Pax2a immunofluorescence showed high expression of tcf21 in Pax2a+ RPCAs at 5 dpi after AKI. Scale bar, 50 μm. e qRT-PCR analysis of tcf21 in WT and penka−/− kidneys following AKI (n = 3 biological replications per group). The data were presented as the fold change relative to the 0 dpi WT group. f qRT-PCR analysis of tcf21 in 7 dpi WT kidneys after administration (at 2, 4, and 6 dpi) of Met-ENK, Con vivo-MO, duox1 vivo-MO, VAS2870, CPI-455, and DMSO following AKI (n = 3 biological replications per group). The data were presented as the fold change relative to the 7 dpi DMSO-treated group. The data in (b), (e), and (f) were analyzed by two-sided t-test and are presented as mean values ± SD. Source data are provided as a Source data file.
|