|
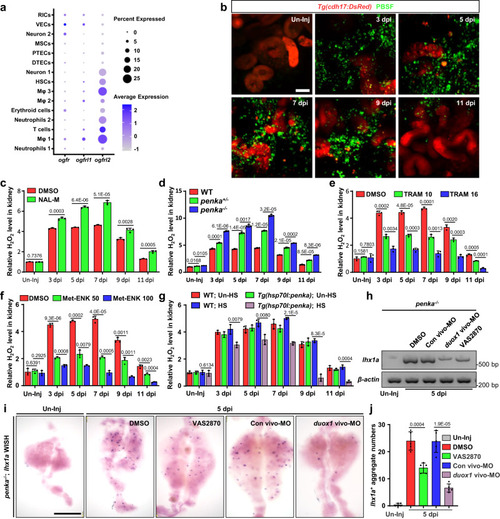
PENK-A regulates H2O2 production. a Gene expression of PENK-A receptors (ogfr, ogfrl1, and ogfrl2) in kidney cells. VECs (vascular endothelial cells), DTECs (distal tubular epithelial cells), Mφ (macrophages), HSCs (hematopoietic stem cells), MSCs (mucin-secreting cells), and RICs (renal interstitial cells). b Confocal images of H2O2 signal in adult Tg(cdh17:DsRed) kidneys after Gent-induced AKI, detected using the PBSF fluorescence probe. Scale bar, 50 μm. c Relative H2O2 concentration in kidneys after NAL-M or DMSO administration following AKI, presented as fold change relative to the DMSO-treated Un-Inj group (n = 3). d Relative H2O2 concentrations in the kidneys of WT, penka+/−, and penka−/− zebrafish following AKI, presented as fold change relative to the Un-Inj WT group (n = 3). e H2O2 concentration in kidneys after TRAM 10 (10 μM TRAM, 10 μL per fish), TRAM 16 (16 μM TRAM, 10 μL per fish), or DMSO administration following AKI, presented as fold change relative to the DMSO-treated Un-Inj groups (n = 3). f H2O2 concentration in kidneys after Met-ENK 50 (50 μM Met-ENK, 10 μL per fish), Met-ENK 100 (100 μM Met-ENK, 10 μL per fish), or DMSO administration following AKI, presented as fold change relative to the DMSO-treated Un-Inj groups (n = 3). g H2O2 concentrations in the kidneys of WT and Tg(hsp70l:penka) with HS or without HS (Un-HS) following AKI, presented as fold change relative to the Un-HS and Un-Inj WT groups (n = 3). No significant differences between Un-HS WT, HS WT, and Un-HS Tg(hsp70l:penka) zebrafish were found using two-tailed t-test. h, i RT-PCR (h) and WISH (i) analyses of lhx1a in 5 dpi penka−/− kidneys after administration (at 2 and 4 dpi) of VAS2870, duox1 vivo-MO, Con vivo-MO, or DMSO after AKI, Scale bar, 600 μm. j Quantification of lhx1a+ RPCAs per kidney (n = 5) for each condition in (i). Data in (c), (d), (e), (f), (g), and (i) were analyzed by two-sided t-test and are presented as mean values ± SD. p values are listed. Source data are provided as a Source data file.
|