IMAGE

Fig. 1

ID
ZDB-IMAGE-231109-30
Source
Figures for Liu et al., 2023
Image
Figure Caption

Fig. 1 
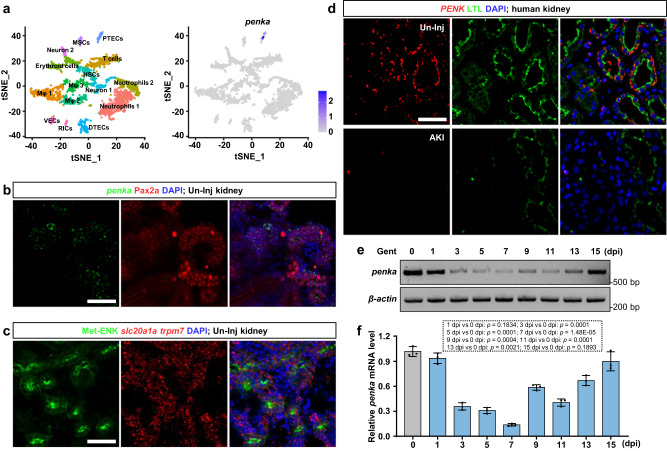
The expression patterns of zebrafish penka and human PENK in the kidneys.

a scRNA-seq analysis revealed that penka was specifically expressed in zebrafish PTECs. t-SNE plots showing zebrafish kidney cell clusters and the expression of penka. VECs, vascular endothelial cells; DTECs, distal tubular epithelial cells; Mφ, macrophages; HSCs, hematopoietic stem cells; MSCs, mucin-secreting cells; and RICs, renal interstitial cells. b Confocal images showing double labeling of FISH-penka and anti-Pax2a in un-injured (Un-Inj) adult zebrafish kidney sections (n  =  3). c Confocal images showing triple labeling of FISH-slc20a1a, FISH-trpm7, and anti-Met-ENK in Un-Inj adult zebrafish kidney sections. The Met-ENK signal co-localized with the signals of slc20a1a and trmp7, which are markers of PCT and PST, respectively (n  =  3). d Confocal images of combined FISH-PENK and LTL staining in kidney sections of patients with AKI and patients with no detectable lesions (Un-Inj). Human PENK was expressed in PTs and downregulated after AKI (n  =  3). e, f RT-PCR (e) and qRT-PCR (f) analyses of penka in zebrafish kidneys during Gent-induced AKI (n  =  3). penka expression was decreased by 1 dpi and reached its lowest level at 7 dpi and returned to its un-injured level at 15 dpi. The data in (f) were analyzed by two-sided t-test and are presented as mean values  ±  SD. Scale bars in (b), (c), and (d), 50 μm. Source data are provided as a Source data file.

Acknowledgments
This image is the copyrighted work of the attributed author or publisher, and ZFIN has permission only to display this image to its users. Additional permissions should be obtained from the applicable author or publisher of the image. Full text @ Nat. Commun.