FIGURE SUMMARY
Title

Zebrafish as model system for the biological characterization of CK1 inhibitors

Authors
Meier, L., Gahr, B.M., Roth, A., Gihring, A., Kirschner, S., Woitaske-Proske, C., Baier, J., Peifer, C., Just, S., Knippschild, U.
Source
Full text @ Front Pharmacol

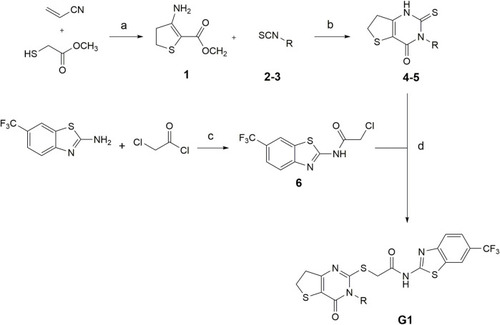
Conditions for the synthesis of compounds G1-4 and G1-5. (a) methanol, DBU 0°C–80°C, 24 h (b) Pyridine, 120°C, 24 h (c) TEA, DCM, rt, 24 h (d) DMF, TEA, N2, 80°C, 2 h (2,4G1-4: R = trifluoromethyl benzyl; 3,5G1-5: R = isobutyl. Modified after (Davoodnia et al., 2008).

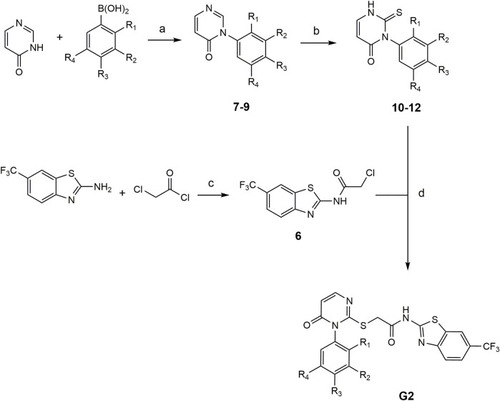
Conditions for the synthesis of compounds G2-4 – G2-6. (a) Pyridine, CuBr, mol sieve (4 Å), DMSO, 90°C, compressed air (b) 1. NaHCO3, Et2O/H2O, rt, 16 h and 2. MeOH, TEA, rt, 16 h (c) inert atm., DMF, TEA, 80°C, 2 h, EA, H2O (d) TEA, DMF, 80°C, 2 h: 7, 10, G2-4: R1 = OCH3, R2-R4 = H. 8, 11, G2-5: R3 = OCH3, R1-R2-R4 = H). 9, 12, G2-6 (R2 = OCH3, R1-R3-R4 = H).

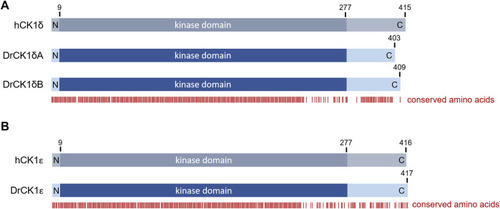
Overview over the amino acid sequence conservation of the human and zebrafish CK1 variants. Alignments between human CK1 and the zebrafish CK1 variants were performed using PRALINE multiple sequence alignment (Centre for Integrative Bioinformatics VU, see also Supplementary Figure S1). Based on the alignment, the figure shows the conservation of certain amino acids indicated by the red bars below. There is a very high conservation visible in the N-terminal and kinase domains whereas the C-terminal region shows more variability (A) Alignment between human CK1δ (hCK1δ) and zebrafish CK1δA and B (DrCK1δA and DrCK1δB). (B) Alignment between human CK1ε (hCK1ε) and zebrafish CK1ε (DrCK1ε).

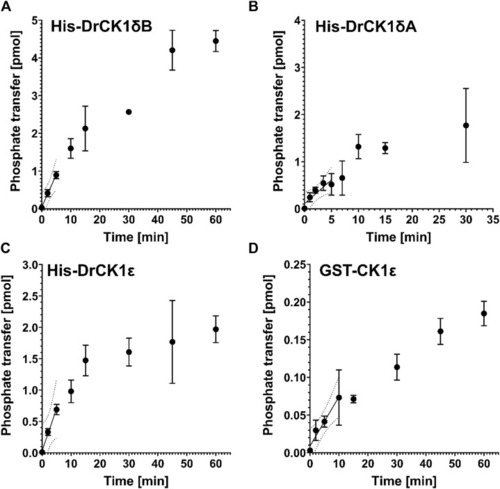
Product-over-time progression curves for α-casein phosphorylation mediated by the zebrafish CK1 isoforms and GST-CK1ε. The time-dependent phosphorylation of α-casein, catalyzed by (A) 70 nM His-DrCK1δA, (B) 33 nM His-DrCK1δB, (C) 7 nM His-DrCK1ε (D) and 70 nM GST-CK1ε was determined in in vitro kinase assays. The ATP-concentration of the reaction mix was 10 μM and 2 g/L substrate were utilized. The assays were performed in presence of the inhibitor solvent DMSO. Linear regression was performed to determine the maximum coefficient of determination (R2) and to identify the initial velocity region (Roth et al., 2021). Product-over-time progression curve for GST-CK1δ was established by Roth et al. (Figures 3, 4) and the data is licensed under a Creative Commons Attribution 4.0 International License (CC BY 4.0) (Roth et al., 2021).

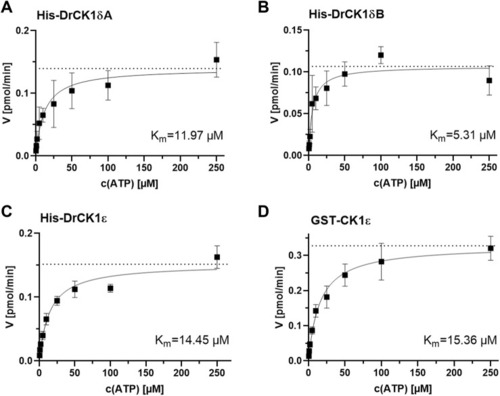
Determination of the kinase-specific Km(ATP) by evaluation of the Michaelis-Menten enzyme kinetic. The Km(ATP) was assessed by performing in vitro kinase assays with different ATP-concentrations (0.5, 1, 2, 5, 10, 25, 50, 100 and 250 µM) and by analyzing the resulting Michaelis-Menten kinetics. The Km(ATP) describes the concentration of the phosphate-donor ATP at which half of the maximal reaction velocity (Vmax, marked by the dashed line) is reached. (A) Michaelis-Menten kinetic for His-DrCK1δA, Km(ATP) = 11.97 µM. (B) Michaelis-Menten kinetic for His-DrCK1δB, Km(ATP) = 5.31 µM. (C) Michaelis-Menten kinetic for His-DrCK1ε, Km(ATP) = 14.45 µM. (D) Michaelis-Menten kinetic for GST-CK1ε, Km(ATP) = 15.36 µM. Km: Michaelis constant for ATP. Michaelis-Menten enzyme kinetic was applied to determine Km. Km(ATP) for GST-CK1δ was established by Roth et al. (Figure 7) and the data is licensed under a Creative Commons Attribution 4.0 International License (CC BY 4.0) (Roth et al., 2021).

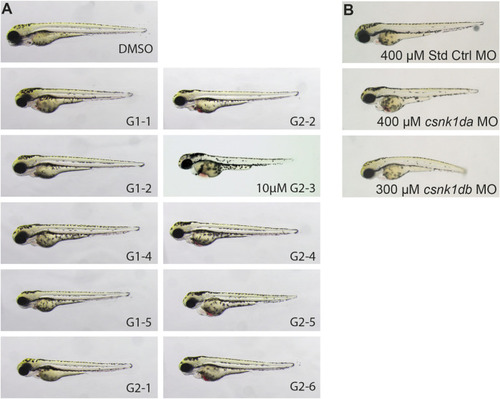
Representative pictures of SMI treated 72 hpf zebrafish embryos after 48 h of treatment and morpholino injected 72 hpf embryos. Treatment with G1-2, G1-3, G1-4 and G2-5 had no effect on zebrafish development or heart function. Treatment with 20 µM of G1-1 and G1-5 had a weak effect on heart development and function with a mild bradycardia and reduced heart rate. Treatment with G2-1, G2-2, G2-4, G2-6, and 10 µM G2-3 resulted in a strong cardiac phenotype, with blood congestion, a strong bradycardia and partially total loss of heart beat (A). Injection of 400 µM Standard Control morpholino (Std Ctrl MO) had no phenotypic influence, injection of 400 µM csnk1da and 300 µM csnk1db morpholino lead to a reduced heart function resulting in blood congestion (B) (n = 10 for each compound, n = 30 for each morpholino).

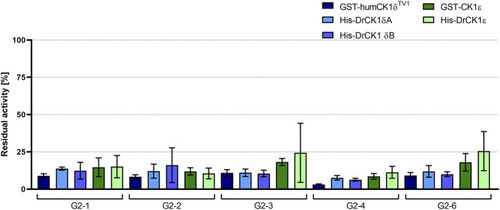
Initial screening of human as well as zebrafish CK1δ and ε with selected inhibitors. The selected inhibitors G2-1, G2-2, G2-3, G2-4 and G2-6 were screened at a concentration of 20 µM in in vitro kinase assays with GST-humCK1δTV1, GST-CK1ε, His-DrCK1δA, His-DrCK1δB and His-DrCK1ε. The residual kinase activity [%] was determined by measuring the radioactively labelled γ-phosphate incorporation into the substrate α-casein by Cherenkov counting. The results of the inhibitor-treated samples were normalized against the DMSO control, plotted against the respective inhibitor and are presented ±standard deviation.

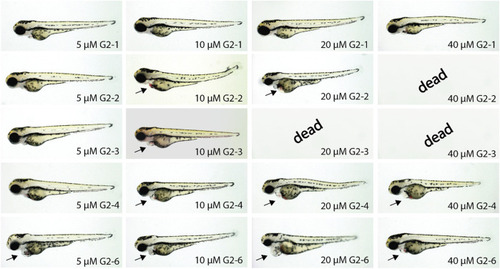
Representative images of SMI-treated zebrafish embryos after 48 h of incubation. Treatment of zebrafish embryos with G2-1, G2-4 and G2-6 showed increasingly severe cardiac malfunctions with increasing compound concentrations. The SMIs G2-2 and G2-3 induced necrosis at concentrations of 40 or 20 μM, respectively. Arrow indicates blood congestion and resulting cardiac edema (n = 20 for each compound).

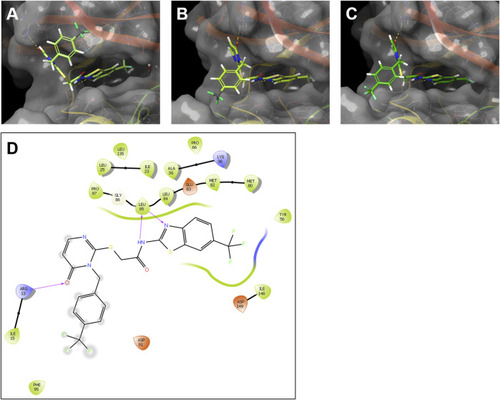
Modelling of the interaction of the SMI G2-2 with human CK1δ and the zebrafish CK1δ variants (A, B). Ligand-protein models of G2-2 with human CK1δ (PDB code 5OKT) (A), zebrafish CK1δA (B) and zebrafish CK1δB (C) were generated using Schrödinger Maestro. Hydrogen bonds between the inhibitor and the respective kinase are shown in dashed lines. (D) Exemplary 2D ligand interaction diagram of zebrafish CK1δA with G2-2. The hydrogen bonds are shown as purple arrows.

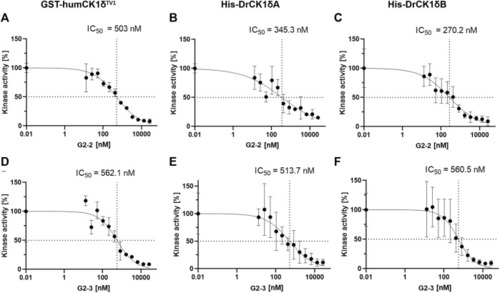
IC50-determination of G2-2 and G2-3 with GST-humCK1δTV1, His-DrCK1δA and His-DrCK1δB. The IWP-derived inhibitors G2-2 and G2-3 were further assessed and IC50-values were determined. The transfer of radioactively labelled γ-phosphate to the substrate α-casein was measured by Cherenkov counting. The inhibitors were applied in different concentrations ranging from 13 to 26667 nM. The standardized kinase- and ATP-concentration as well as reaction time can be found in Supplementary Table S5. The kinase activity of the inhibitor-treated samples was normalized to the DMSO-controls. The results are shown as the mean value ± standard deviation. The experiments were conducted in technical triplicates. (A) IC50-determination of G2-2 with GST-humCK1δTV1. (B) IC50-determination of G2-2 with His-DrCK1δA. (C) IC50-determination of G2-2 with His-DrCK1δB. IC50: 50% inhibitory concentration. (D) IC50-determination of G2-3 with GST-humCK1δTV1. (E) IC50-determination of G2-3 with His-DrCK1δA. (F) IC50-determination of G2-3 with His-DrCK1δB. IC50: 50% inhibitory concentration.

Representative pictures of hearts of inhibitor-treated and csnk1d MO injected embryos. Embryos were either treated with DMSO, 10 µM G2-2 or 10 µM G2-3 for 48 h from 24 hpf, or injected with csnk1da, csnk1db or control Morpholino (Std Ctr). DMSO and Std Ctr MO had wildtype heart morphology and function. Treatment with 10 µM G2-2 and G2-3 as well as injection of 400 µM csnk1da or 300 µM csnk1db Morpholino resulted in reduced heart function (n = 30 for each compound and morpholino).

Acknowledgments
This image is the copyrighted work of the attributed author or publisher, and ZFIN has permission only to display this image to its users. Additional permissions should be obtained from the applicable author or publisher of the image. Full text @ Front Pharmacol