
Image
|
Figure Caption
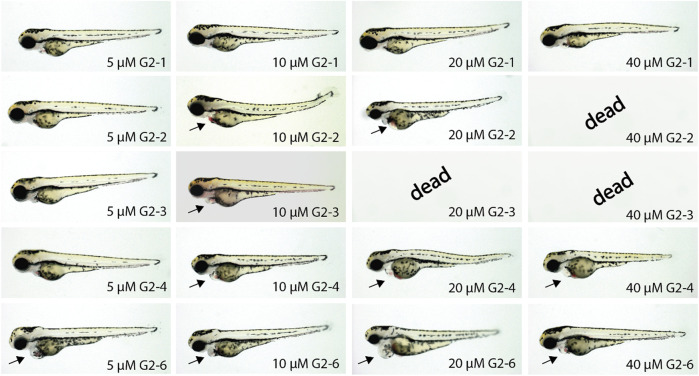
FIGURE 8
Representative images of SMI-treated zebrafish embryos after 48 h of incubation. Treatment of zebrafish embryos with G2-1, G2-4 and G2-6 showed increasingly severe cardiac malfunctions with increasing compound concentrations. The SMIs G2-2 and G2-3 induced necrosis at concentrations of 40 or 20 μM, respectively. Arrow indicates blood congestion and resulting cardiac edema (n = 20 for each compound).
Acknowledgments
This image is the copyrighted work of the attributed author or publisher, and
ZFIN has permission only to display this image to its users.
Additional permissions should be obtained from the applicable author or publisher of the image.
Full text @ Front Pharmacol