FIGURE

FIGURE 10

ID
ZDB-FIG-231002-235
Publication
Meier et al., 2023 - Zebrafish as model system for the biological characterization of CK1 inhibitors
Other Figures
All Figure Page
Back to All Figure Page
FIGURE 10

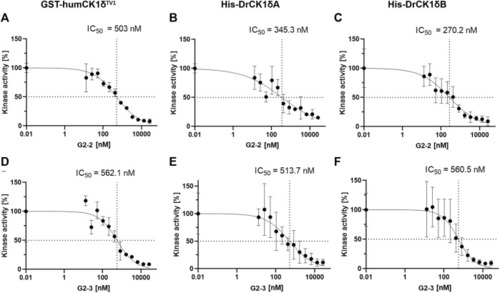
IC50-determination of G2-2 and G2-3 with GST-humCK1δTV1, His-DrCK1δA and His-DrCK1δB. The IWP-derived inhibitors G2-2 and G2-3 were further assessed and IC50-values were determined. The transfer of radioactively labelled γ-phosphate to the substrate α-casein was measured by Cherenkov counting. The inhibitors were applied in different concentrations ranging from 13 to 26667 nM. The standardized kinase- and ATP-concentration as well as reaction time can be found in Supplementary Table S5. The kinase activity of the inhibitor-treated samples was normalized to the DMSO-controls. The results are shown as the mean value ± standard deviation. The experiments were conducted in technical triplicates. (A) IC50-determination of G2-2 with GST-humCK1δTV1. (B) IC50-determination of G2-2 with His-DrCK1δA. (C) IC50-determination of G2-2 with His-DrCK1δB. IC50: 50% inhibitory concentration. (D) IC50-determination of G2-3 with GST-humCK1δTV1. (E) IC50-determination of G2-3 with His-DrCK1δA. (F) IC50-determination of G2-3 with His-DrCK1δB. IC50: 50% inhibitory concentration.

Expression Data

Expression Detail
Antibody Labeling
Phenotype Data

Phenotype Detail
Acknowledgments
This image is the copyrighted work of the attributed author or publisher, and ZFIN has permission only to display this image to its users. Additional permissions should be obtained from the applicable author or publisher of the image. Full text @ Front Pharmacol