IMAGE

FIGURE 4

ID
ZDB-IMAGE-231002-226
Source
Figures for Meier et al., 2023
Image
Figure Caption

FIGURE 4

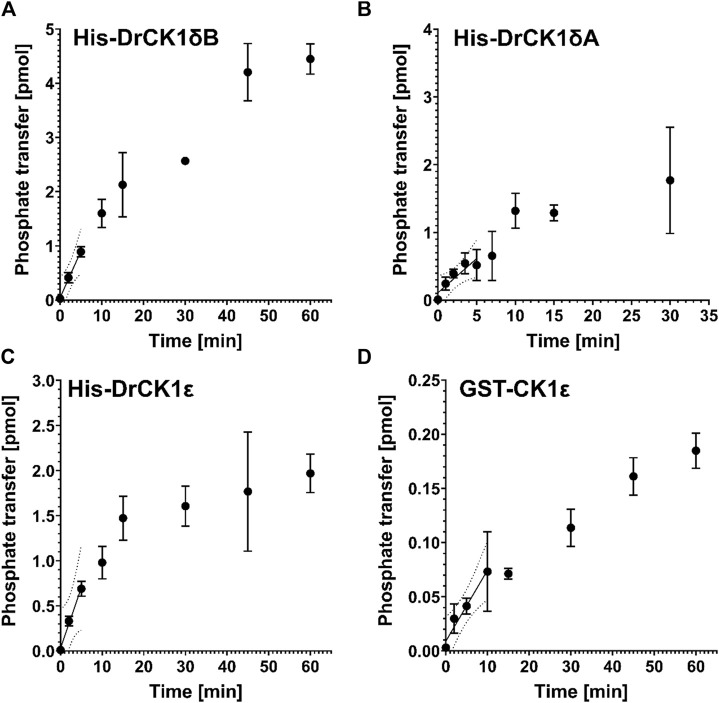
Product-over-time progression curves for α-casein phosphorylation mediated by the zebrafish CK1 isoforms and GST-CK1ε. The time-dependent phosphorylation of α-casein, catalyzed by (A) 70 nM His-DrCK1δA, (B) 33 nM His-DrCK1δB, (C) 7 nM His-DrCK1ε (D) and 70 nM GST-CK1ε was determined in in vitro kinase assays. The ATP-concentration of the reaction mix was 10 μM and 2 g/L substrate were utilized. The assays were performed in presence of the inhibitor solvent DMSO. Linear regression was performed to determine the maximum coefficient of determination (R2) and to identify the initial velocity region (Roth et al., 2021). Product-over-time progression curve for GST-CK1δ was established by Roth et al. (Figures 3, 4) and the data is licensed under a Creative Commons Attribution 4.0 International License (CC BY 4.0) (Roth et al., 2021).

Acknowledgments
This image is the copyrighted work of the attributed author or publisher, and ZFIN has permission only to display this image to its users. Additional permissions should be obtained from the applicable author or publisher of the image. Full text @ Front Pharmacol