
- Title
-
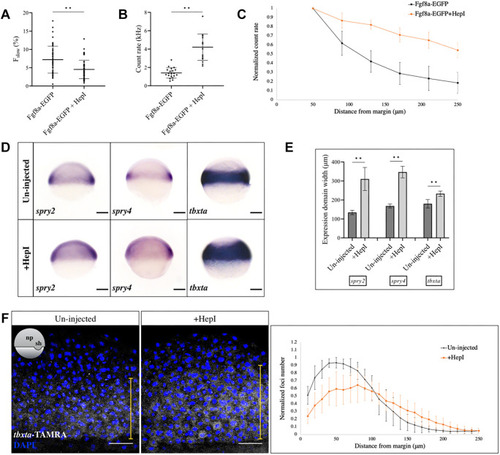
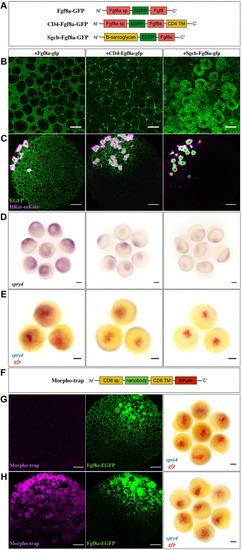
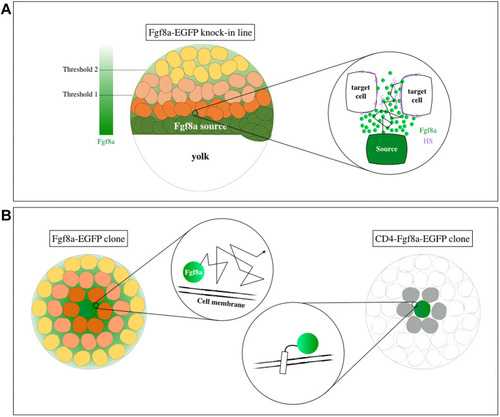
Real-time monitoring of endogenous Fgf8a gradient attests to its role as a morphogen during zebrafish gastrulation
- Authors
- Harish, R.K., Gupta, M., Zöller, D., Hartmann, H., Gheisari, A., Machate, A., Hans, S., Brand, M.
- Source
- Full text @ Development
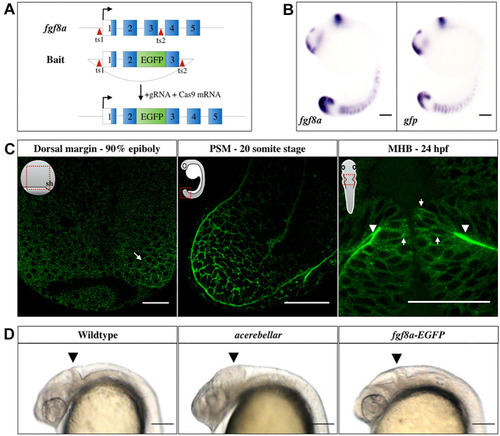
EXPRESSION / LABELING:
|
EXPRESSION / LABELING:
PHENOTYPE:
|
PHENOTYPE:
|
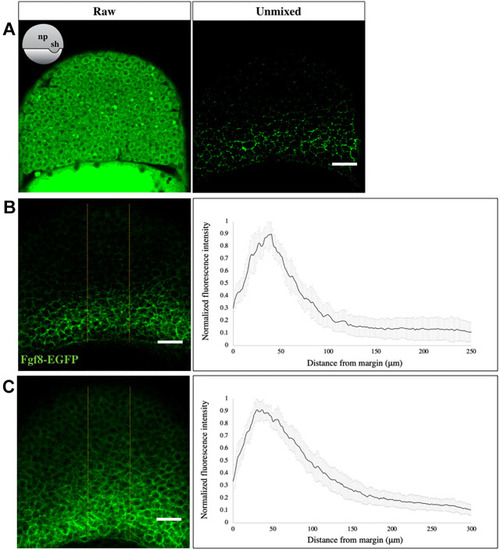
EXPRESSION / LABELING:
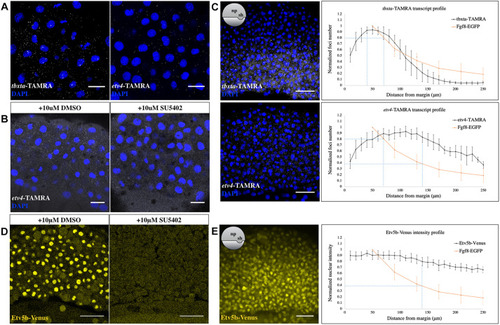
PHENOTYPE:
|
|
|
|