|
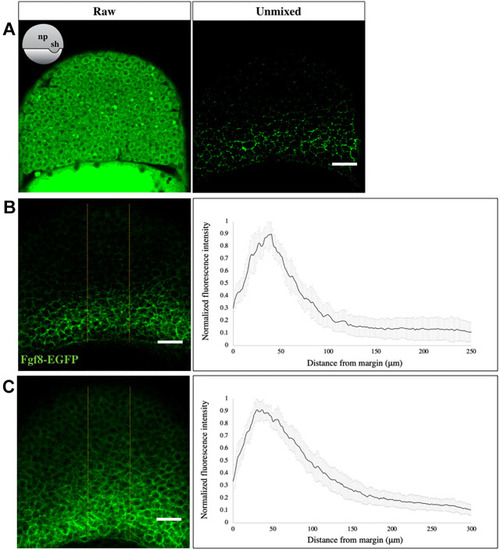
Fgf8a-EGFP forms a gradient during gastrulation. (A) EGFP fluorescence in an optical section of the neural plate in early gastrula stage fgf8a-EGFP embryos, as visualized using the GaAsP detector, before (left) and after (right) linear unmixing. The orientation of embryos is shown schematically in the inset. np, neural plate; sh, shield. (B,C) Sum-intensity z-projected images, derived after linear unmixing (left), used to extract fluorescence intensity profiles in the neural plate (yellow boundaries) at early (B) and mid-gastrula (C) stages. The analysis reveals a graded distribution of Fgf8a towards the animal pole (right). N=15 embryos. Scale bars: 50 μm. Data are mean±s.d.
|