IMAGE

Fig. 3.

ID
ZDB-IMAGE-231012-16
Source
Figures for Harish et al., 2023
Image
Figure Caption

Fig. 3.

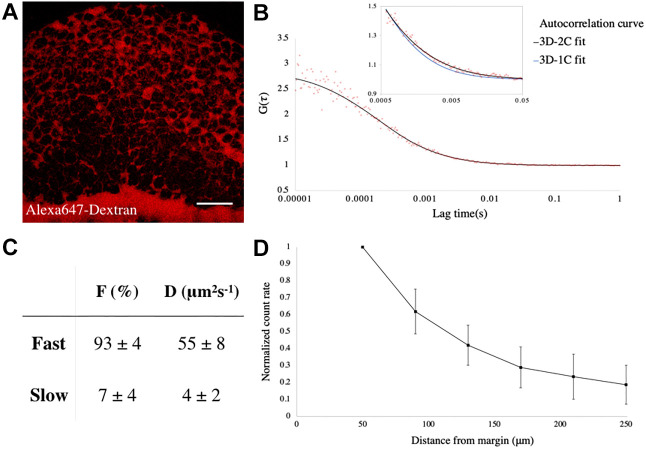
Fgf8a-EGFP propagates by diffusing via the extracellular space. (A) Extracellular space (ECS) in an early gastrula embryo, as visualized by Alexa-647-tagged Dextran injection. The orientation of the embryo is as in Fig. 2A. Scale bar: 50 μm. (B) FCS autocorrelation curve from the ECS of a Tg(fgf8a:fgf8a-EGFP) embryo fitted with 2-C (black curve) and 1-C (blue curve in inset) 3D-diffusion models. (C) Results from fitting with the 3D-2C diffusion model. F, fraction of each component; D, diffusion coefficient. n=52 measurements. (D) Plot of count rate, derived from FCS analysis versus distance from the margin at early gastrula showing graded distribution of Fgf8a in the ECS along the animal-vegetal axis. N=20 embryos. Data are mean±s.d.

Acknowledgments
This image is the copyrighted work of the attributed author or publisher, and ZFIN has permission only to display this image to its users. Additional permissions should be obtained from the applicable author or publisher of the image. Full text @ Development