IMAGE

Fig. 5.

ID
ZDB-IMAGE-231012-18
Source
Figures for Harish et al., 2023
Image
Figure Caption

Fig. 5.

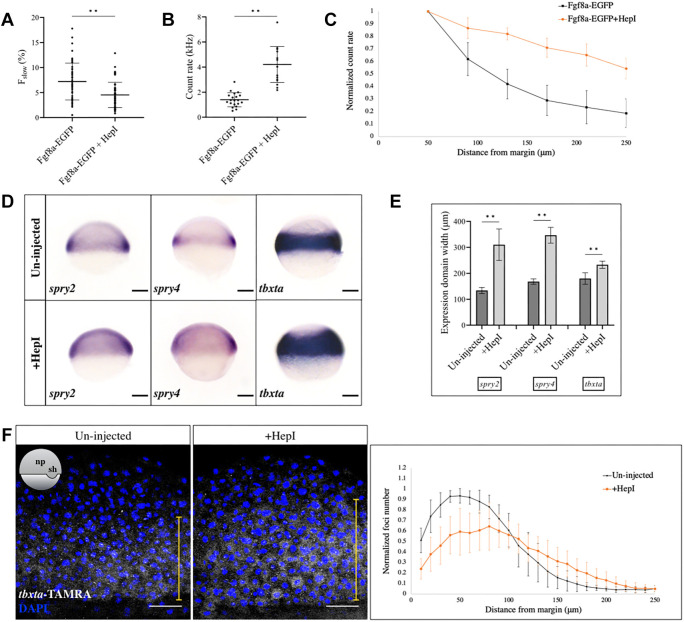
Manipulation of the Fgf8a input alters the signaling output. (A) Injection of HepI reduces the proportion of the slow-moving component of Fgf8a-EGFP, as detected by FCS, in the extracellular spaces. n=52 measurements for Fgf8a-EGFP, n=56 for HepI-injected. **P<0.0001. (B) FCS count rates for Fgf8a-EGFP in the extracellular spaces near the embryonic margin in uninjected and HepI-injected embryos. Count rate is increased upon HepI injection. n=20 for uninjected, n=17 for HepI. **P<0.0001. (C) Plot of count rate versus distance from margin in control (black) and HepI-injected (orange) cases. N=20 embryos for control, N=13 for HepI. (D) In situ hybridization against spry2, spry4 and tbxta in control and HepI-injected early gastrula embryos. Lateral views are shown. Scale bars: 100 μm. (E) Quantification of expression domains of genes as in D, along the animal-vegetal axis. **P<0.0001. (F) smFISH against tbxta in uninjected and HepI-injected embryos at early gastrula, and plot of normalized transcript number versus distance from the margin. tbxta expression is reduced near the margin and increased in its range away from the margin (yellow line) upon HepI injection. Orientation of embryos is shown schematically in inset. N=10. Scale bars: 50 μm. Data are mean±s.d.

Acknowledgments
This image is the copyrighted work of the attributed author or publisher, and ZFIN has permission only to display this image to its users. Additional permissions should be obtained from the applicable author or publisher of the image. Full text @ Development