
- Title
-
Anti-HER2 Super Stealth Immunoliposomes for Targeted-Chemotherapy
- Authors
- Canato, E., Grigoletto, A., Zanotto, I., Tedeschini, T., Campara, B., Quaglio, G., Toffoli, G., Mandracchia, D., Dinarello, A., Tiso, N., Argenton, F., Sayaf, K., Guido, M., Gabbia, D., De Martin, S., Pasut, G.
- Source
- Full text @ Adv. Healthc. Mater.
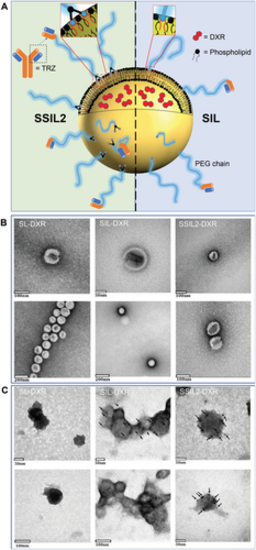
Schematic representation and TEM images of liposomes. A) Drawing of SSIL2 and SIL highlighting the different anchoring of PEG chains on the phospholipid bilayer. B) TEM characterization of SL-DXR, SIL-DXR, and SSIL2-DXR. C) Immunolabeling of targeted liposomes (SIL and SSIL2) compared to non-targeted liposomes (SL) as the negative control. The black dots indicated by the arrows correspond to the gold nanoparticles (5 nm) conjugated to a secondary anti-mouse antibody binding the primary anti-Trastuzumab antibody, thus allowing indirect visualization of the Fab’ fragments on the surface of liposomes. The gold nanoparticles were not detected in non-targeted liposomes. |
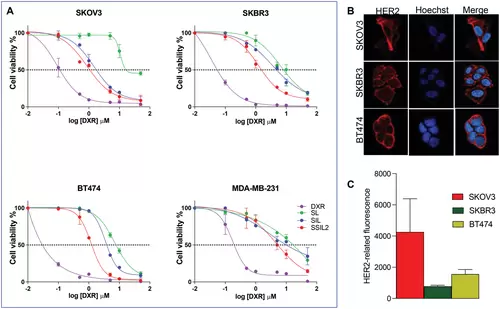
In vitro evaluation of the anticancer activity. A) In vitro concentration-response curves of SKOV3 (HER2+), SKBR3 (HER2+), BT474 (HER2+), and MDA-MB-231 (HER2-) treated with DXR-loaded targeted (SIL and SSIL2) and non-targeted (SL) liposomes. B) Expression of HER2 in the plasma membrane of HER2+ cells, and C) quantification of HER2-related fluorescence per cell. |
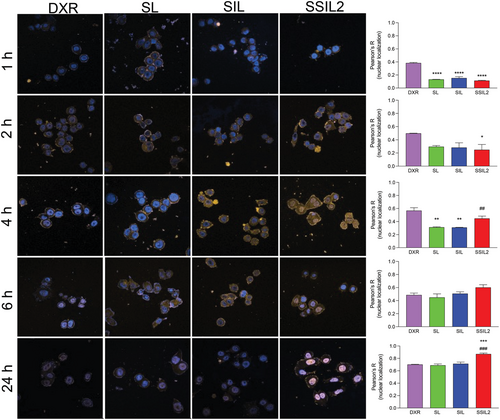
Cell internalization study. DXR internalization and nuclear localization by SKBR3 cells (HER2+) after 1 h, 2 h, 4 h, 6 h, and 24 h of treatment with the liposomal formulations (5 µm in DXR equiv.), compared to free DXR (0.02 µm). The Pearson's R |
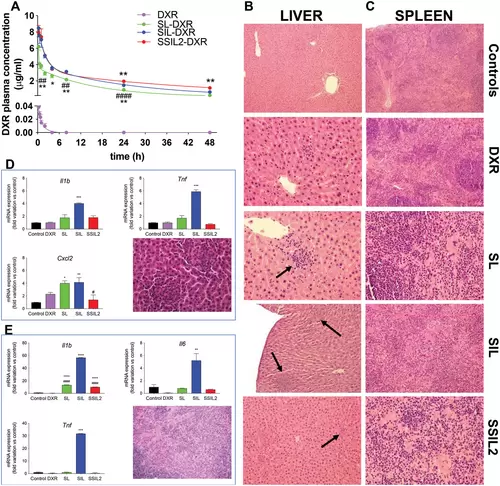
Pharmacokinetic profiles and toxicity analysis of liposomes in rats. A) In vivo pharmacokinetic profiles of free DXR, SL-DXR, SIL-DXR, and SSIL2-DXR. *p < 0.05 and **p < 0.01 versus SIL-DXR, ##p < 0.01 and ####p |
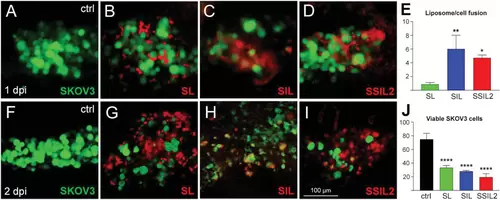
Evaluation of liposome formulations in SKOV3-engrafted zebrafish embryos. A–E) By 1 dpi, liposomes (red) have reached SKOV3 cells (green; untreated control in (A)), with different degrees of fusion ((B)–(D), chart in (E)). F–J) At 2 dpi, the tumor mass is reduced with G–I) all formulations, compared to the untreated control ((F); chart in (J)). All images are lateral views of the embryonic yolk, anterior to the left. N = 7 measures/condition; *p < 0.05, **p < 0.01, ****p < 0.0001. |
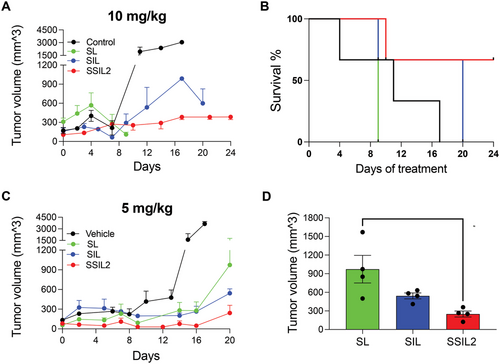
In vivo anticancer activity in SKOV3 ovarian cancer xenograft mouse model. A) Tumor growth and B) Kaplan–Meier curve of xenograft mice treated with 10 mg kg−1 (DXR equiv.). C) Tumor growth and D) tumor volumes at sacrifice of xenograft mice treated with the formulations at the lower DXR dose (5 mg kg−1 equiv.). |
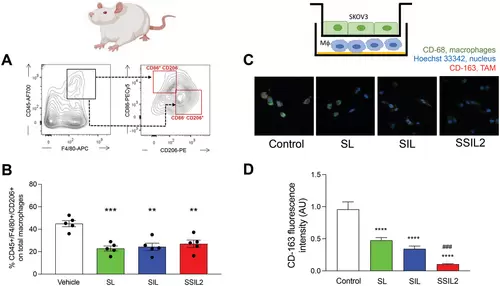
Study of liposomes effect on TAMs. Gating strategy used for the A) identification and B) quantification of TAMs in the in vivo study. C,D) In vitro effect of the treatments on CD68+/CD163+ MΦ cells obtained by coculturing THP-1 with SKOV3 cells. Magnification: 63×. *p < 0.05, **p < 0.01, ***p < 0.001, ****p < 0.0001 versus vehicle treated mice or control cells, ####p < 0.0001 versus control cells. |