
|
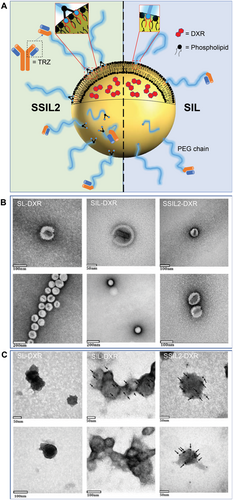
Fig. 1 Schematic representation and TEM images of liposomes. A) Drawing of SSIL2 and SIL highlighting the different anchoring of PEG chains on the phospholipid bilayer. B) TEM characterization of SL-DXR, SIL-DXR, and SSIL2-DXR. C) Immunolabeling of targeted liposomes (SIL and SSIL2) compared to non-targeted liposomes (SL) as the negative control. The black dots indicated by the arrows correspond to the gold nanoparticles (5 nm) conjugated to a secondary anti-mouse antibody binding the primary anti-Trastuzumab antibody, thus allowing indirect visualization of the Fab’ fragments on the surface of liposomes. The gold nanoparticles were not detected in non-targeted liposomes.