Image


                        Figure Caption


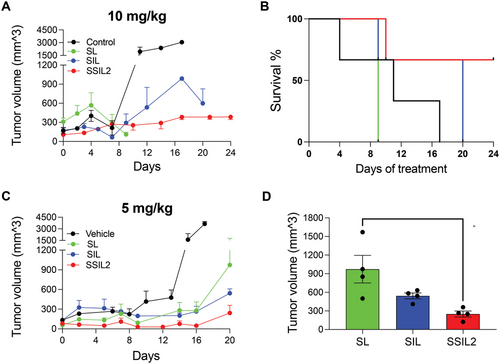
Fig. 6 In vivo anticancer activity in SKOV3 ovarian cancer xenograft mouse model. A) Tumor growth and B) Kaplan–Meier curve of xenograft mice treated with 10 mg kg−1 (DXR equiv.). C) Tumor growth and D) tumor volumes at sacrifice of xenograft mice treated with the formulations at the lower DXR dose (5 mg kg−1 equiv.).
                
                    
                        Acknowledgments


This image is the copyrighted work of the attributed author or publisher, and
ZFIN has permission only to display this image to its users.
Additional permissions should be obtained from the applicable author or publisher of the image.
      Full text @ Adv. Healthc. Mater.


        