
Image
|
Figure Caption
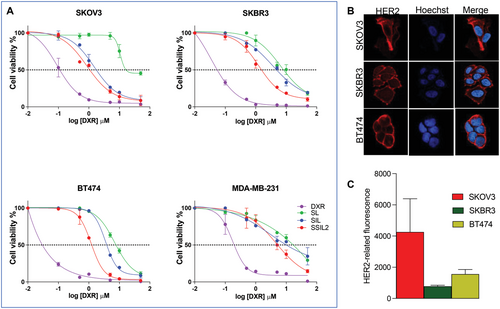
Fig. 2 In vitro evaluation of the anticancer activity. A) In vitro concentration-response curves of SKOV3 (HER2+), SKBR3 (HER2+), BT474 (HER2+), and MDA-MB-231 (HER2-) treated with DXR-loaded targeted (SIL and SSIL2) and non-targeted (SL) liposomes. B) Expression of HER2 in the plasma membrane of HER2+ cells, and C) quantification of HER2-related fluorescence per cell.
Acknowledgments
This image is the copyrighted work of the attributed author or publisher, and
ZFIN has permission only to display this image to its users.
Additional permissions should be obtained from the applicable author or publisher of the image.
Full text @ Adv. Healthc. Mater.