
Image
|
Figure Caption
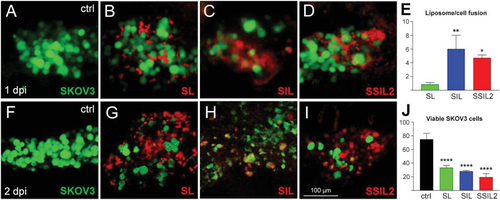
Fig. 5 Evaluation of liposome formulations in SKOV3-engrafted zebrafish embryos. A–E) By 1 dpi, liposomes (red) have reached SKOV3 cells (green; untreated control in (A)), with different degrees of fusion ((B)–(D), chart in (E)). F–J) At 2 dpi, the tumor mass is reduced with G–I) all formulations, compared to the untreated control ((F); chart in (J)). All images are lateral views of the embryonic yolk, anterior to the left. N = 7 measures/condition; *p < 0.05, **p < 0.01, ****p < 0.0001.
Acknowledgments
This image is the copyrighted work of the attributed author or publisher, and
ZFIN has permission only to display this image to its users.
Additional permissions should be obtained from the applicable author or publisher of the image.
Full text @ Adv. Healthc. Mater.