FIGURE SUMMARY
Title

Adhesion GPCR Gpr126 (Adgrg6) Expression Profiling in Zebrafish, Mouse, and Human Kidney

Authors
Cazorla-Vázquez, S., Kösters, P., Bertz, S., Pfister, F., Daniel, C., Dedden, M., Zundler, S., Jobst-Schwan, T., Amann, K., Engel, F.B.
Source
Full text @ Cells

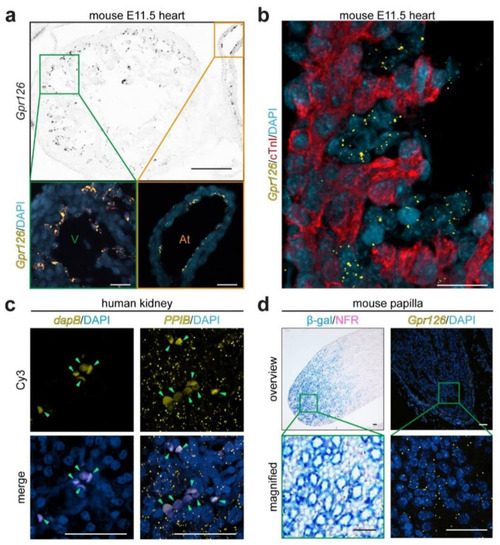
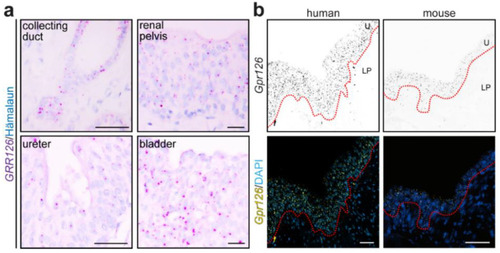
Validation of RNAscope® for mouse and human kidneys. (
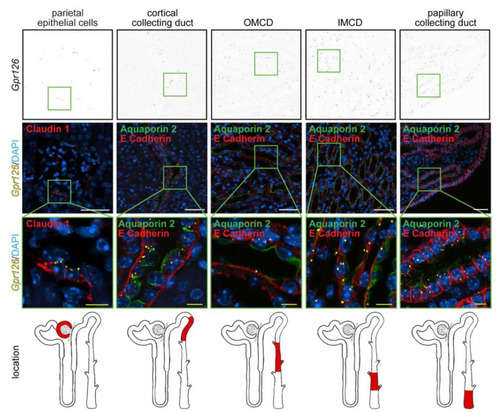
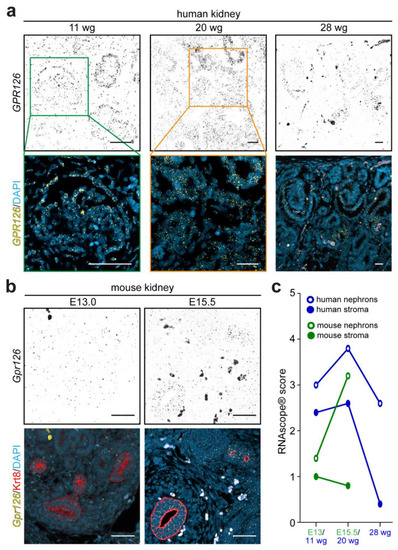
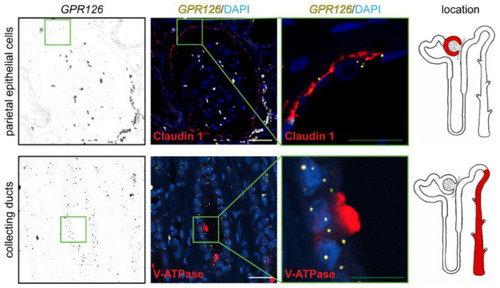
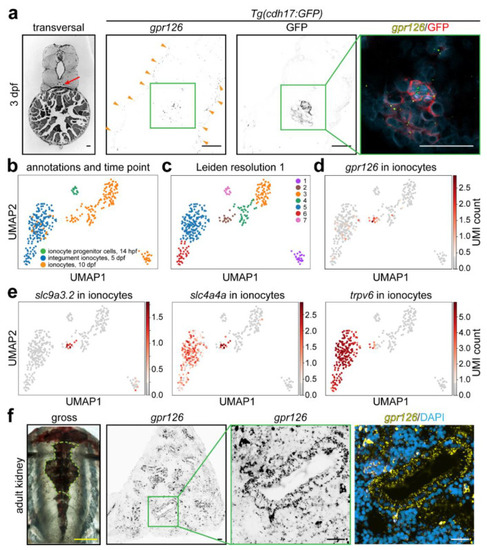
a) Gpr126 mRNA-targeting RNAscope® probes were used on transversal sections of FFPE mouse wildtype embryonic hearts at 11.5. Signal (yellow dots) was found lining the ventricular (V) and atrial (At) chambers. DAPI was utilized to visualize nuclei. Black scale bar: 100 µm; white scale bars: 25 µm. (b) RNAscope® technology was combined with anti-cardiac troponin I (cTnI) antibody staining to identify the myocardium (red). Gpr126 signal was localized in the cTnI-negative endocardial cells of mouse embryonic hearts at E11.5. Scale bar: 25 µm. (c) RNAscope® probes targeting the bacterial dapB mRNA and the human PPIB mRNA were used on human FFPE renal tissues as negative and positive technical controls, respectively. Signal detection (yellow dots) was performed using a dye with excitation and emission light properties equivalent to those of cyanine 3 (Cy3). Note: when present, red blood cells exhibit autofluorescence and are seen as bigger corpuscles (green arrowheads). Scale bars: 50 μm. (d) Gpr126-lacZ reporter mouse line revealed β-galactosidase activity (β-gal, blue) in the adult renal medullary papilla upon X-gal staining on a nuclear fast red (NFR, pink) background staining. This papillary expression pattern was confirmed by fluorescent RNAscope® in situ hybridization (yellow dotty signal) in adult FFPE kidney sections. Scale bars: 50 μm.

Gpr126 expression during metanephric development. (a) RNAscope® probes targeting the human GPR126 mRNA were used on human FFPE embryonic metanephric kidney sections at 11, 20, and 28 weeks of gestation (wg). Over time, the GPR126 expression pattern (yellow dotty signal) concentrates in the developing nephrons, compared to stromal cells. DAPI was utilized in (a,b) to visualize nuclei. (b) RNAscope® probes targeting the mouse Gpr126 detected low, but ubiquitously distributed, signal (yellow dotty signal) in the mouse FFPE-developing metanephros sections at E13.0 compared to samples obtained at E15.5, where signal was found more localized in cytokeratin-8-positive ureteric bud cells (red). Scale bars: 100 μm. (c) Representation of the RNAscope® signal score means obtained from epithelial (circumferences) and stromal (circles) cell types of human (blue) and mouse (green) developing metanephroi during the physiological nephrogenesis burst window (20 wg in human, n = 5; E15.5 in mouse, n = 3), earlier (11 wg in human, n = 4; E13.0 in mouse, n = 3), and later (28 wg in human, n = 3) stages.

Renal expression of Gpr126 in adult mice. RNAscope® probes targeting the murine Gpr126 mRNA (yellow dots) were combined with renal-specific immunostaining (red) on FFPE kidney tissue of wildtype C57BL/6 mice. Gpr126 signal colocalized the claudin 1-positive parietal epithelial cells lining the Bowman´s capsule and the aquaporin 2/E-cadherin-positive collecting duct. Note Gpr126 expression in the cortical, inner (IMCD), and papillary segments of the collecting duct is enriched compared to the outer segment (OMCD). DAPI was utilized to visualize nuclei. White scale bars: 50 µm. Yellow scale bars: 10 µm.

GPR126 expression in the adult human kidney. RNAscope® probes targeting the human GPR126 mRNA were used on human FFPE renal tissues in combination with antibodies serving as renal-specific markers. GPR126 signal (yellow dots) colocalized the parietal epithelial cell marker claudin 1 and the collecting duct epithelial cell marker V-ATPase (markers in red). DAPI was utilized to visualize nuclei. White scale bars: 50 μm. Green scale bars: 20 μm. The red color in the nephron schemes depicts the specific locations where the respective markers are expected to be found.

Gpr126 is expressed throughout the urinary collecting system. (a) RNAscope® probes targeting the human GPR126 mRNA were used on human FFPE urinary tissues. GPR126 signal (magenta dots) was found in the epithelial compartment of the urinary collecting system, collecting duct epithelial cells and transitional epithelium (urothelium) of the renal pelvis, ureter, and bladder. Hematoxylin was utilized to visualize nuclei. Scale bars: 20 μm. (b) RNAscope® probes targeting Gpr126 mRNAs were used on FFPE renal pelvis sections of human and mouse. Both species showed Gpr126 enrichment in the urothelium (U) of the renal pelvis mucosa (yellow dots), contrary to the lamina propria (LP) layer beneath. DAPI was utilized to visualize nuclei. Dashed red line represents the approximate location of the basement membrane at the urothelium–lamina propria junction. Scale bars: 50 μm.

gpr126 expression in zebrafish kidneys and ionocytes. (a) RNAscope® probes targeting the zebrafish gpr126 RNA were used on FFPE transversal sections of a renal tubule-specific reporter zebrafish line at 3 days post fertilization (dpf). Red arrow: pronephros. Orange arrowheads: ionocytes. Bright-field picture taken from ZFIN Atlas of Zebrafish Anatomy. (be) UMAP plot of single-cell RNAseq data. (b) Ionocytes are represented with false coloring, showing ionocytes progenitor cells at 14 h post fertilization (hpf, light green), integument ionocytes at 5 dpf (blue), and ionocytes at 10 dpf (orange). Cell types were annotated in the original study. (c) Leiden clustering with a resolution of 1. (d) UMAP plot of gpr126 in ionocytes, whereby the normalized and scaled UMI (Unique Molecular Identifier) counts are colored in a scale from 0 UMI counts (gray) to the highest UMI count (dark red). (e) UMAP plot as described in (d), depicting slc9a3.2, slc4a4a, and trpv6 in ionocytes. (f) gpr126 signal in the adult (3 months) zebrafish kidney indicates high expression in a subset of tubular and non-tubular cells. Green dashed line: kidney trunk region, from which sections were obtained. Scale bars: yellow: 0.5 cm, black and white: 25 µm.

Acknowledgments
This image is the copyrighted work of the attributed author or publisher, and ZFIN has permission only to display this image to its users. Additional permissions should be obtained from the applicable author or publisher of the image. Full text @ Cells