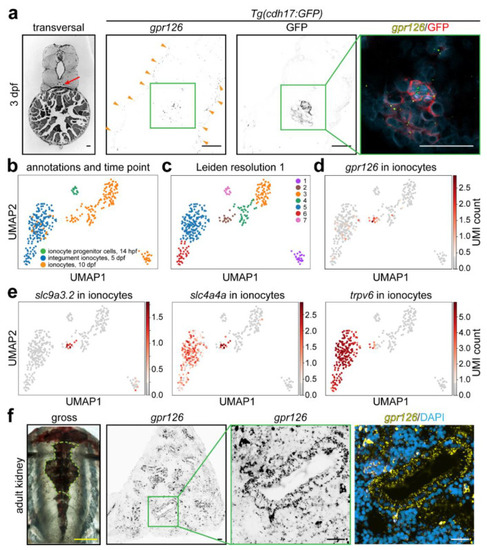
gpr126 expression in zebrafish kidneys and ionocytes. (a) RNAscope® probes targeting the zebrafish gpr126 RNA were used on FFPE transversal sections of a renal tubule-specific reporter zebrafish line at 3 days post fertilization (dpf). Red arrow: pronephros. Orange arrowheads: ionocytes. Bright-field picture taken from ZFIN Atlas of Zebrafish Anatomy. (b–e) UMAP plot of single-cell RNAseq data. (b) Ionocytes are represented with false coloring, showing ionocytes progenitor cells at 14 h post fertilization (hpf, light green), integument ionocytes at 5 dpf (blue), and ionocytes at 10 dpf (orange). Cell types were annotated in the original study. (c) Leiden clustering with a resolution of 1. (d) UMAP plot of gpr126 in ionocytes, whereby the normalized and scaled UMI (Unique Molecular Identifier) counts are colored in a scale from 0 UMI counts (gray) to the highest UMI count (dark red). (e) UMAP plot as described in (d), depicting slc9a3.2, slc4a4a, and trpv6 in ionocytes. (f) gpr126 signal in the adult (3 months) zebrafish kidney indicates high expression in a subset of tubular and non-tubular cells. Green dashed line: kidney trunk region, from which sections were obtained. Scale bars: yellow: 0.5 cm, black and white: 25 µm.
|
