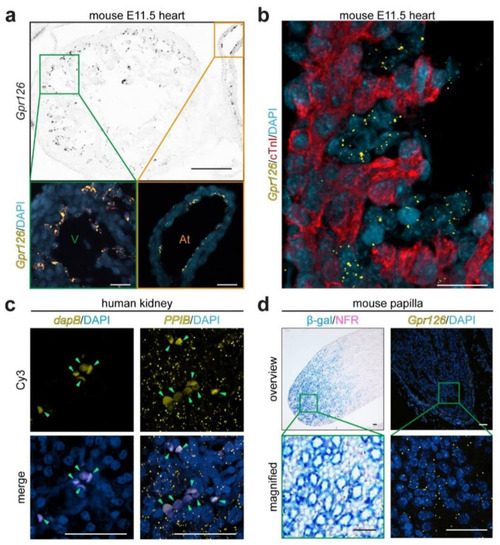
Validation of RNAscope® for mouse and human kidneys. (a) Gpr126 mRNA-targeting RNAscope® probes were used on transversal sections of FFPE mouse wildtype embryonic hearts at 11.5. Signal (yellow dots) was found lining the ventricular (V) and atrial (At) chambers. DAPI was utilized to visualize nuclei. Black scale bar: 100 µm; white scale bars: 25 µm. (b) RNAscope® technology was combined with anti-cardiac troponin I (cTnI) antibody staining to identify the myocardium (red). Gpr126 signal was localized in the cTnI-negative endocardial cells of mouse embryonic hearts at E11.5. Scale bar: 25 µm. (c) RNAscope® probes targeting the bacterial dapB mRNA and the human PPIB mRNA were used on human FFPE renal tissues as negative and positive technical controls, respectively. Signal detection (yellow dots) was performed using a dye with excitation and emission light properties equivalent to those of cyanine 3 (Cy3). Note: when present, red blood cells exhibit autofluorescence and are seen as bigger corpuscles (green arrowheads). Scale bars: 50 μm. (d) Gpr126-lacZ reporter mouse line revealed β-galactosidase activity (β-gal, blue) in the adult renal medullary papilla upon X-gal staining on a nuclear fast red (NFR, pink) background staining. This papillary expression pattern was confirmed by fluorescent RNAscope® in situ hybridization (yellow dotty signal) in adult FFPE kidney sections. Scale bars: 50 μm.
|
