FIGURE SUMMARY
Title

Surface Electrical Impedance Myography Detects Skeletal Muscle Atrophy in Aged Wildtype Zebrafish and Aged gpr27 Knockout Zebrafish

Authors
Rutkove, S.B., Chen, Z.Z., Pandeya, S., Callegari, S., Mourey, T., Nagy, J.A., Nath, A.K.
Source
Full text @ Biomedicines

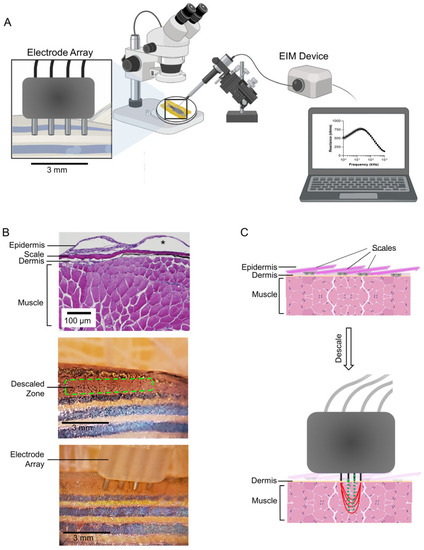
Surface electrical impedance myography in zebrafish skeletal muscle: Experimental set-up. (A) Cartoon depiction of the experimental procedure. The measurements were completed in <1 min and graphed in real-time. (B) H&E-stained tissue section of a region of epaxial caudal muscle (note the asterisk denotes an artifact of histology; in living zebrafish, the epidermis is in contact with and covers the scale). Image of descaled caudal musculature. The descaled region is outlined with a green dashed line. Image of the 4-pin surface electrode placed on top of the descaled caudal musculature, and positioned along the anterior–posterior axis below the dorsal fin. (C) Cartoon depiction of the surface electrode during data acquisition and tissue layers at the site of measurement (note this drawing is not to scale). The red lines depict the low-amplitude, high-frequency alternating electrical current that is applied to the muscle through a pair of outer electrodes, while the green lines represent the resulting voltages that are measured through a second pair of inner electrodes (created in BioRender.com).

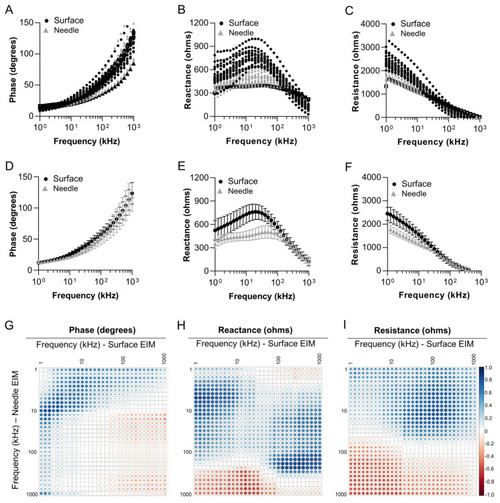
Relationships between surface EIM and needle EIM in adult zebrafish skeletal muscle. Multifrequency (1 kHz–1 MHz) graphs for EIM parameters of (A) phase, (B) reactance, and (C) resistance. Data displayed were acquired using a surface electrode (black) and a needle electrode (gray). Surface EIM data were collected. Then, needle EIM was collected on the same animal (n = 14; 8 months of age). Surface EIM and needle EIM data for each animal were plotted. Multifrequency graphs for (D) phase, (E) reactance, and (F) resistance are also shown as mean ± standard deviation. Correlation matrices for (G) phase, (H) reactance, and (I) resistance. Blue circles are positive correlations and red circles are negative correlations. White indicates zero correlation. Darker and larger circles represent higher correlation values, and lighter and smaller circles represent lower correlations.

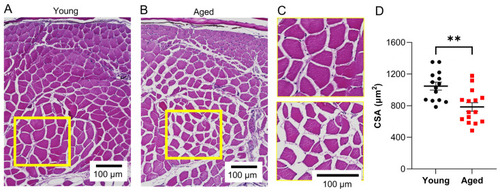
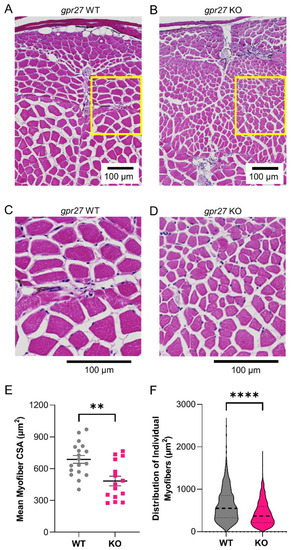
Age-related atrophy of skeletal muscle fibers in wildtype zebrafish. Representative H&E-stained images depicting epaxial caudal musculature in (A) young (8 months (~20% of lifespan)) and (B) aged zebrafish (36 months (~85% of lifespan)). (C) Zoomed-in images of the yellow boxes shown in panels (A) and (B); top image = young, bottom image = aged. (D) Cross-sectional myofiber area was quantified in H&E sections obtained from the caudal musculature of young and aged animals (n = 14). ** p ≤ 0.01.

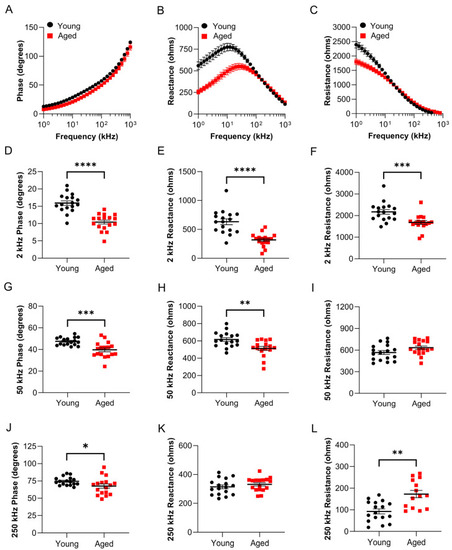
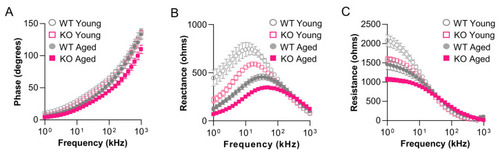
Surface electrical impedance myography detects age-related muscle changes in wildtype zebrafish. sEIM parameters (phase, reactance, and resistance) were assessed at a range of frequencies (1 kHz–1 MHz) in the epaxial caudal muscles of young (8 months, ~20% lifespan; n = 17) and aged zebrafish (36 months, ~85% lifespan; n = 17). Multifrequency graphs are shown for 3 impedance parameters: (A) phase, (B) reactance, and (C) resistance. Single frequency analyses at (D) 2 kHz phase (p < 0.000001, q = 0.000002), (E) 2 kHz reactance (p = 0.000004, q = 0.000006), (F) 2 kHz resistance (p = 0.000867, q = 0.000683), (G) 50 kHz phase (p = 0.000252, q = 0.000265), (H) 50 kHz reactance (p = 0.006081, q = 0.003192), (I) 50 kHz resistance, (J) 250 kHz phase (p = 0.044723, q = 0.020125), (K) 250 kHz reactance, (L) 250 kHz resistance (p = 0.001384, q = 0.000872). * p ≤ 0.05, ** p ≤ 0.01, *** p ≤ 0.001, **** p ≤ 0.0001.

Aged gpr27 KOs exhibit greater myofiber atrophy as compared to aged sibling controls. Representative H&E-stained images depicting epaxial caudal musculature in (A) aged WT (36 months; 85% lifespan) and (B) aged gpr27 KO zebrafish (36 months; 85% lifespan). (C) Zoomed-in image of the yellow box shown in panel (A). (D) Zoomed-in image of the yellow box shown in panel (B). (E) Cross-sectional myofiber area and (F) distribution of the sizes of individual myofibers were quantified in H&E sections obtained from the caudal musculature of aged WT and aged KO animals (n = 15–18). ** p ≤ 0.01, **** p ≤ 0.0001.

Genetic deletion of gpr27 exacerbates age-related atrophy of caudal muscle. sEIM parameters were measured at frequencies of 1 kHz–1 MHz in the epaxial caudal muscles of aged sibling WTs (36 months, 85% lifespan, n = 14) and aged gpr27 KOs (36 months, 85% lifespan, n = 14). Multifrequency graphs for (A) phase, (B) reactance, and (C) resistance (n = 14 per genotype). Single frequency analyses at (D) 2 kHz phase (p = 0.0006, q = 0.0012), (E) 2 kHz reactance (p = 0.0011, q = 0.0012), (F) 2 kHz resistance (p = 0.0273, q = 0.0082), (G) 50 kHz phase (p = 0.0229, q = 0.0082), (H) 50 kHz reactance (p = 0.0101, q = 0.0070), (I) 50 kHz resistance, (J) 250 kHz phase (p = 0.0258, q = 0.0082), (K) 250 kHz reactance, (L) 250 kHz resistance (p = 0.0249, q = 0.0082). * p ≤ 0.05, ** p ≤ 0.01, *** p ≤ 0.001.

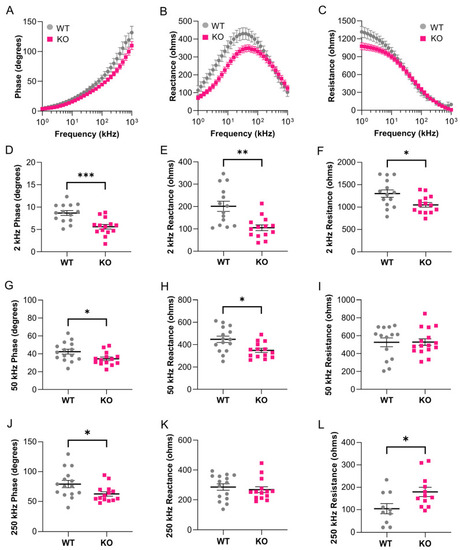
Surface electrical impedance myography detects skeletal muscle defects in young gpr27 KOs. sEIM parameters were measured at frequencies of 1 kHz–1 MHz in the epaxial caudal muscles of young sibling WTs (12 months; 30% lifespan) and young gpr27 KOs (12 months; 30% lifespan). Multifrequency graphs for (A) phase, (B) reactance, and (C) resistance in young animals (n = 12–14 per genotype). Note the data from aged WT and gpr27 KO animals from Figure 6 (36 months; 85% lifespan) were also plotted for comparison (n = 14 per genotype).

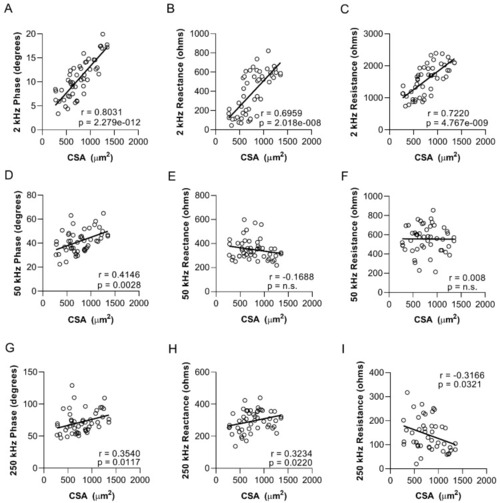
Myofiber size in zebrafish skeletal muscle strongly correlates with low-frequency phase, reactance, and resistance values. Correlation between cross-sectional myofiber area in the epaxial caudal musculature and sEIM values: (A) 2 kHz phase, (B) 2 kHz reactance, (C) 2 kHz resistance, (D) 50 kHz phase, (E) 50 kHz reactance, (F) 50 kHz resistance, (G) 250 kHz phase, (H) 250 kHz reactance, and (I) 250 kHz resistance (n = 50). Analyses included young (8 months; 20% lifespan) and aged (36 months; 85% lifespan) zebrafish data combined. Each panel displays Spearman r and p values.

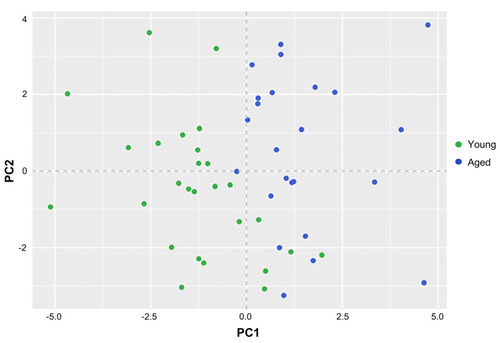
Principal component analysis of EIM measurements in young and aged zebrafish. Nine EIM parameters were used in this analysis (phase: 2, 50, and 250 kHz; reactance: 2, 50, and 250 kHz; and resistance: 2, 50, and 250 kHz). Data from 51 animals was used (n = 27 young, i.e., 8 months, and n = 24 aged, i.e., 36 months). The first two components of the PCA explained 86.2% of the variance between the young and aged zebrafish. The EIM parameters of phase at 2 kHz phase, resistance at 2 kHz resistance, and reactance at 2 kHz, 50 kHz, and 250 kHz contributed to >80% of PC 1. Resistance at 50 kHz and 250 kHz and phase at 50 kHz and 250 kHz contributed to >80% of PC 2.

Acknowledgments
This image is the copyrighted work of the attributed author or publisher, and ZFIN has permission only to display this image to its users. Additional permissions should be obtained from the applicable author or publisher of the image. Full text @ Biomedicines