
Image
|
Figure Caption
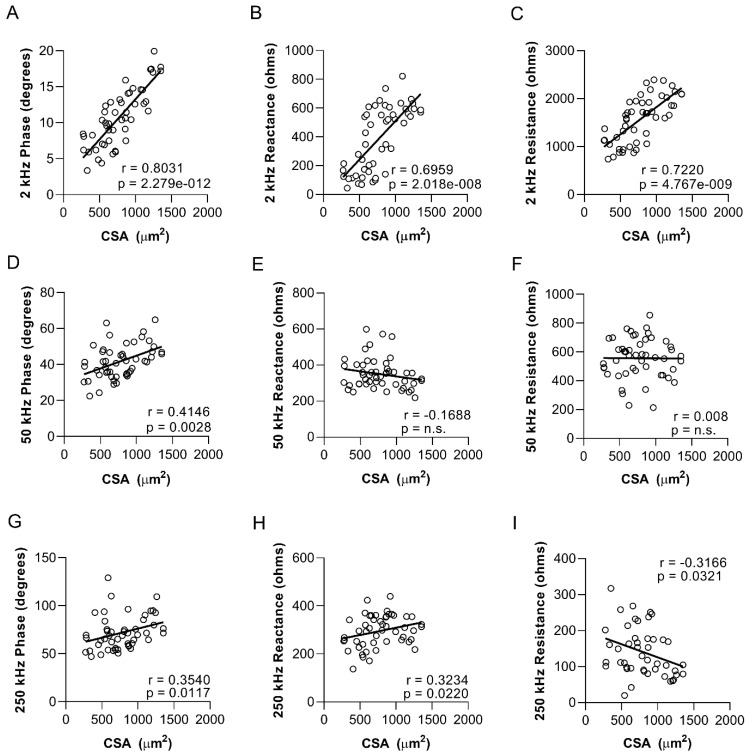
Figure 8
Myofiber size in zebrafish skeletal muscle strongly correlates with low-frequency phase, reactance, and resistance values. Correlation between cross-sectional myofiber area in the epaxial caudal musculature and sEIM values: (
Acknowledgments
This image is the copyrighted work of the attributed author or publisher, and
ZFIN has permission only to display this image to its users.
Additional permissions should be obtained from the applicable author or publisher of the image.
Full text @ Biomedicines