
FIGURE
Figure 8
- ID
- ZDB-FIG-230731-103
- Publication
- Rutkove et al., 2023 - Surface Electrical Impedance Myography Detects Skeletal Muscle Atrophy in Aged Wildtype Zebrafish and Aged gpr27 Knockout Zebrafish
- Other Figures
- All Figure Page
- Back to All Figure Page
Figure 8
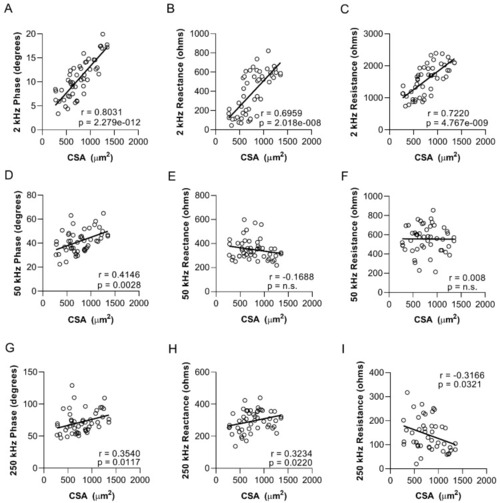
Myofiber size in zebrafish skeletal muscle strongly correlates with low-frequency phase, reactance, and resistance values. Correlation between cross-sectional myofiber area in the epaxial caudal musculature and sEIM values: ( |
Expression Data
Expression Detail
Antibody Labeling
Phenotype Data
Phenotype Detail
Acknowledgments
This image is the copyrighted work of the attributed author or publisher, and
ZFIN has permission only to display this image to its users.
Additional permissions should be obtained from the applicable author or publisher of the image.
Full text @ Biomedicines