FIGURE

Figure 1

ID
ZDB-FIG-230731-95
Publication
Rutkove et al., 2023 - Surface Electrical Impedance Myography Detects Skeletal Muscle Atrophy in Aged Wildtype Zebrafish and Aged gpr27 Knockout Zebrafish
Other Figures
All Figure Page
Back to All Figure Page
Figure 1

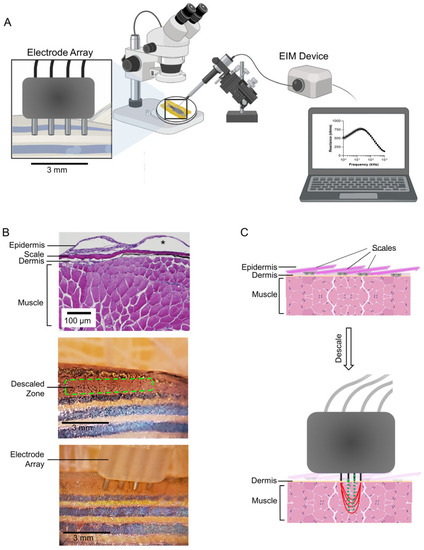
Surface electrical impedance myography in zebrafish skeletal muscle: Experimental set-up. (A) Cartoon depiction of the experimental procedure. The measurements were completed in <1 min and graphed in real-time. (B) H&E-stained tissue section of a region of epaxial caudal muscle (note the asterisk denotes an artifact of histology; in living zebrafish, the epidermis is in contact with and covers the scale). Image of descaled caudal musculature. The descaled region is outlined with a green dashed line. Image of the 4-pin surface electrode placed on top of the descaled caudal musculature, and positioned along the anterior–posterior axis below the dorsal fin. (C) Cartoon depiction of the surface electrode during data acquisition and tissue layers at the site of measurement (note this drawing is not to scale). The red lines depict the low-amplitude, high-frequency alternating electrical current that is applied to the muscle through a pair of outer electrodes, while the green lines represent the resulting voltages that are measured through a second pair of inner electrodes (created in BioRender.com).

Expression Data

Expression Detail
Antibody Labeling
Phenotype Data

Phenotype Detail
Acknowledgments
This image is the copyrighted work of the attributed author or publisher, and ZFIN has permission only to display this image to its users. Additional permissions should be obtained from the applicable author or publisher of the image. Full text @ Biomedicines