FIGURE

Figure 2

ID
ZDB-FIG-230731-96
Publication
Rutkove et al., 2023 - Surface Electrical Impedance Myography Detects Skeletal Muscle Atrophy in Aged Wildtype Zebrafish and Aged gpr27 Knockout Zebrafish
Other Figures
All Figure Page
Back to All Figure Page
Figure 2

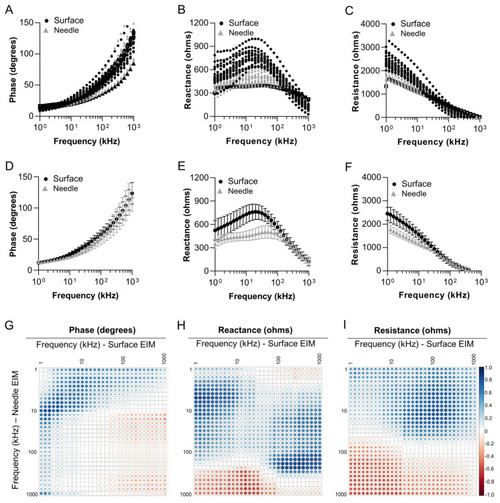
Relationships between surface EIM and needle EIM in adult zebrafish skeletal muscle. Multifrequency (1 kHz–1 MHz) graphs for EIM parameters of (A) phase, (B) reactance, and (C) resistance. Data displayed were acquired using a surface electrode (black) and a needle electrode (gray). Surface EIM data were collected. Then, needle EIM was collected on the same animal (n = 14; 8 months of age). Surface EIM and needle EIM data for each animal were plotted. Multifrequency graphs for (D) phase, (E) reactance, and (F) resistance are also shown as mean ± standard deviation. Correlation matrices for (G) phase, (H) reactance, and (I) resistance. Blue circles are positive correlations and red circles are negative correlations. White indicates zero correlation. Darker and larger circles represent higher correlation values, and lighter and smaller circles represent lower correlations.

Expression Data

Expression Detail
Antibody Labeling
Phenotype Data

Phenotype Detail
Acknowledgments
This image is the copyrighted work of the attributed author or publisher, and ZFIN has permission only to display this image to its users. Additional permissions should be obtained from the applicable author or publisher of the image. Full text @ Biomedicines