FIGURE SUMMARY
Title

Using Zebrafish to Dissect the Interaction of Mycobacteria with the Autophagic Machinery in Macrophages

Authors
Muñoz-Sánchez, S., Varela, M., van der Vaart, M., Meijer, A.H.
Source
Full text @ Biology (Basel)

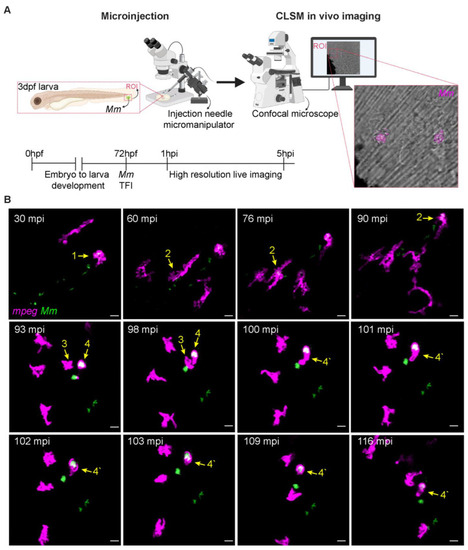
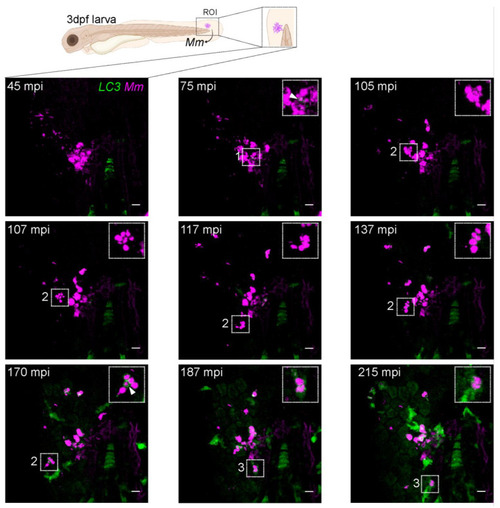
TFI high-resolution live imaging. (A) Schematic of Mm tail fin injection and imaging in zebrafish larvae (created with BioRender online website, https://www.biorender.com, accessed on 30 January 2023). Fluorescently labeled Mm was microinjected into the tail fin of 3 dpf larvae. Live samples were mounted in low melting point agarose and imaged. Confocal laser scanning microscopy (CLSM) live imaging was performed on the region of interest (ROI) starting from 30 mpi. (B) Early events of Mm infection in the zebrafish tail fin. Transgenic (mpeg1.1:mCherry-F) zebrafish larvae, where macrophages are fluorescently labeled (pseudo color magenta), were infected with 100 CFU of E2-Crimson-labelled Mm (pseudocolor green). Images are maximum projection stills of the first 2 h of time-lapse (Supplementary Videos S1 and S2). At 30 mpi, the first macrophage containing a bacteria cluster is observed, arrow 1. In the next 30 min, the number of recruited macrophages increases, and phagocytic events are observed, arrow 2. At 93 mpi, a macrophage (arrow 3) approaches a second macrophage containing bacteria (arrow 4), and both have formed a single cell at 100 mpi (arrow 4′). Scale bar: 10 μm.

Mm infection induces an early LC3 increase in macrophages. Double transgenic (mpeg1.1:mCherry-F/CMV:GFP-LC3) zebrafish larvae, labeling macrophages (pseudo color cyan) and LC3 autophagy-related protein (green), were infected with 100 CFU of E2-crimson Mm (pseudo color magenta) following the TFI protocol. The figure shows the maximum projections of time-lapse crops of the injected area (Supplementary Video S3). Within the indicated time sequence from 60 and 156 mpi, macrophages are increasingly recruited to the site of infection. At 60 mpi, bacteria clusters are observed in association with the LC3 signal (arrowheads 1 and 2). The mpeg1.1:mCherry-F signal is shown separately to confirm the localization of the bacteria inside macrophages (arrowheads 1′ and 2′). The white square zooms in on arrowhead1, where a selection of the Z-stack is shown to unmasks the Mm cluster from the LC3 signal. Note that the high bacterial load of some macrophages at 60 mpi was comparable to the 93 mpi time point in Figure 1, suggesting slight differences in the injected dose. The level of LC3 signal in macrophages increases over time in infected (arrowheads 3/3′) and uninfected macrophages (arrowheads 4/4′). Scale bar: 10 μm.

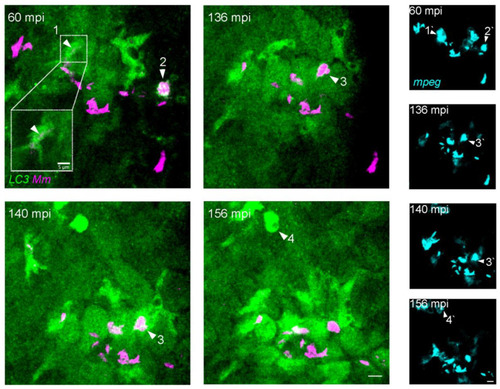
Intracellular dynamics of LC3 association with Mm. Double transgenic (mpeg1.1:mCherry-F/CMV:GFP-LC3 zebrafish larvae, labeling macrophages (pseudo color cyan) and LC3 autophagy-related protein (green), were infected with 100 CFU of E2-crimson Mm (pseudo color magenta) following the TFI protocol. (A) Maximum projection of the entire time-lapse field of view of the injected area (Supplementary Video S4). At 90 mpi, LC3-positive, large (arrowhead 1), and small (arrowheads 2 and 4) Mm clusters are observed. At 107 mpi, an additional LC3-positive Mm cluster is within the field of view (arrowhead 2). The corresponding bright field (BF) images of 90 mpi show magnifications of the cells with intracellular clusters of bacteria, indicated by arrowheads 1 and 3. Cellular borders are outlined with dashed lines. (B) Zoomed-in areas corresponding to the arrowheads in A showing the mpeg1.1:mCherry-F signal (pseudo color cyan) to confirm the localization of Mm inside macrophages (C) Time series of zoomed-in areas corresponding to the arrowheads in A. Arrowhead 1 displays LC3-positive spacious containing a large Mm cluster, dynamically interacting with LC3-positive empty vesicles (yellow arrows). Arrowhead 2, LC3-positive compound vesicles associated with a small Mm cluster and undergoing vesicle fusion (yellow arrows 180–187 mpi). Arrowhead 3 points at an LC3-negative large Mm cluster that is observed over the entire time-lapse duration without any variation in size or distribution inside the cell compartments (the cell was out of focus due to adjustment of the tissue between 210–219 min)). Arrowhead 4, Compact Mm-containing vesicle inside a highly motile cell in close association with LC3 signal. LC3 bright puncta (white arrow) and tubular (yellow arrow) structures are adjacent to the bacteria. Scale bar: 10 μm.

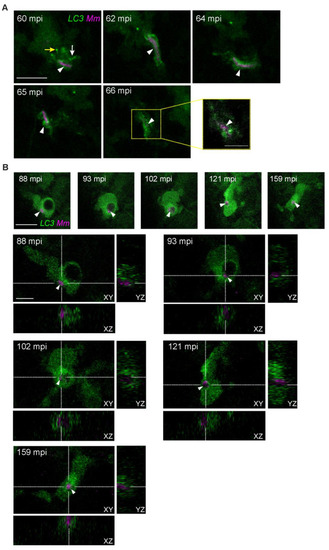
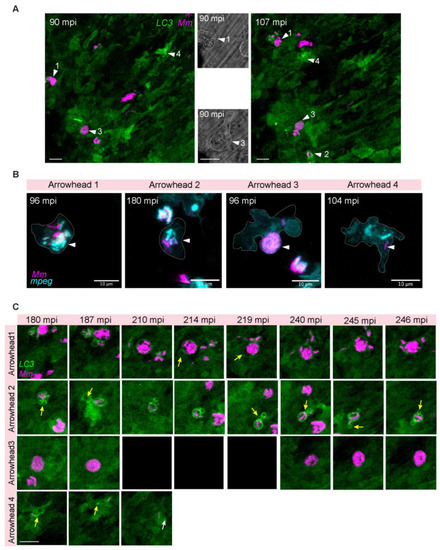
Heterogenous dynamic morphologies of LC3-positive Mm-containing vesicles. Transgenic (CMV:GFP-LC3) zebrafish larvae, labeling LC3 autophagy-related protein (green), were infected with 100 CFU of Mm-mCherry (pseudo color magenta) following the TFI protocol. (A) Maximum projection stills of an infected macrophage that reshapes an LC3-positive Mm-containing vesicle (arrowhead) during migration (60–65 mpi) (Supplementary Video S5). Note how the Mm-containing vesicle (arrowhead) is surrounded by puncta (yellow arrow) and tubular (white arrow) LC3-positive structures and subsequently changes into an elongated form (arrowhead, 62–64 mpi), then reshapes (65 mpi). A zoomed-in Z stack selection of the LC-positive structures at 66 min (outlined yellow) is shown to reveal the presence of Mm. (B) Orthogonal view of the complete Z-stacks, stills capturing the moment when an Mm cluster (white arrowhead) is incorporated into an LC3-positive spacious vesicle (88–93 mpi), after which the vesicle reshapes to a compact form (102–159 mpi) (Supplementary Video S6). Scale bars: 10 μm for all maximum projection stills in A and B, and 5 μm for the zoomed-in area in A and the orthogonal views in B.

Early dissemination of Mm infection. Transgenic (CMV:GFP-LC3) zebrafish larvae, labeling LC3 autophagy-related protein (green), were infected with 300 CFU of Mm-mCherry (pseudo color magenta) following the TFI protocol. Maximum projection stills are shown of the entire time-lapse field of view of the injected area, with the ROI enlarged in the insets (Supplementary Video S7). At 75 mpi, the first LC3-positive Mm-containing vesicles are seen (inset, arrowhead). ROI 2 follows a big phagocytosed bacteria cluster displaced surrounding the core infection site while fragmented into smaller clusters. At 170 mpi, clear LC3-positive spacious vesicles engulf some previously fragmented clusters (inset, arrowhead). Area 2 follows a different LC3-positive Mm cluster. At 215 mpi, the phagocytic cell moves towards the proximity of the caudal vein area at the bottom of the field of view. Scale bar: 10 μm.

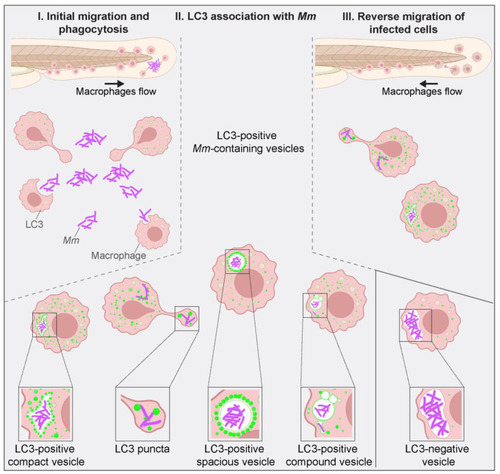
Schematic overview of LC3-associations with Mm-containing vesicles. Zebrafish in vivo imaging of Mm infection using the TFI protocol allowed us to distinguish between different LC3-vesicle membrane associations upon Mm infection. Macrophages are recruited to the site of infection at <30 mpi, and initial phagocytosis is observed at 30 mpi (Figure 1). At 60 mpi, LC3-vesicle membrane associations are visible in the proximity of bacterial clusters and colocalizing with them (Figure 4). The scheme illustrates the typically observed shapes: LC3-positive compact vesicle (Figure 2), LC3 puncta (Figure 4), LC3-positive spacious vesicle (Figure 5), and LC3-positive compound vesicles (Figure 3). Around 200 mpi, cells carrying bacteria inside LC3-positive vesicles were seen migrating away from the site of infection towards the caudal vein area, possibly disseminating the infection. Such motility was not observed for cells containing large LC3-negative bacterial clusters. Figure created with BioRender.

Acknowledgments
This image is the copyrighted work of the attributed author or publisher, and ZFIN has permission only to display this image to its users. Additional permissions should be obtained from the applicable author or publisher of the image. Full text @ Biology (Basel)