IMAGE

Figure 1

ID
ZDB-IMAGE-230630-109
Source
Figures for Muñoz-Sánchez et al., 2023
Image
Figure Caption

Figure 1

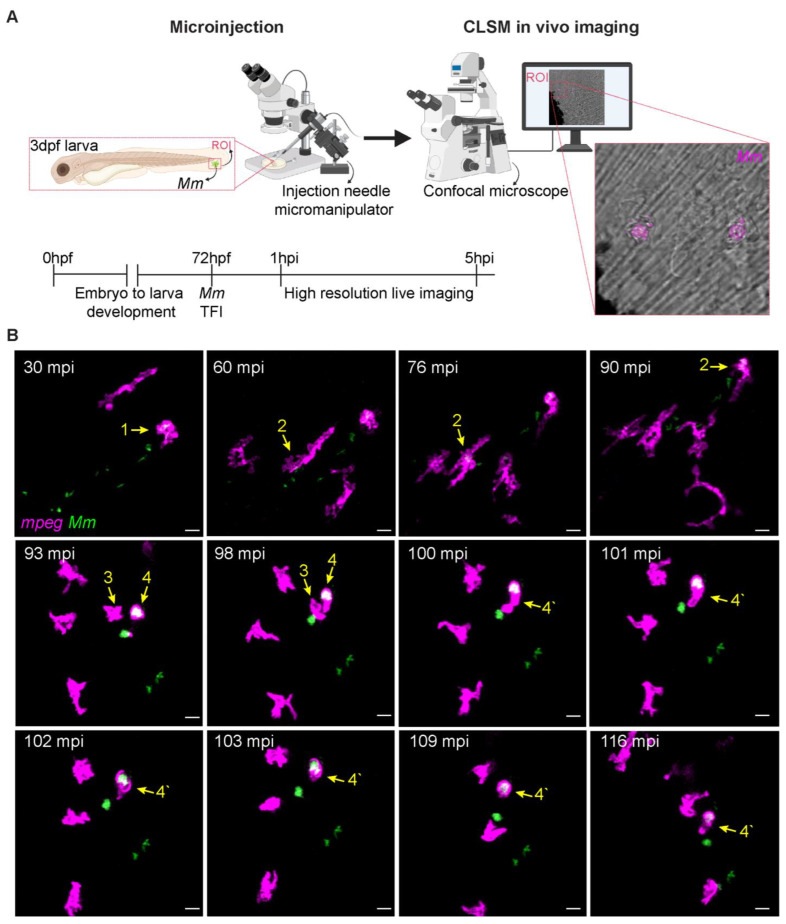
TFI high-resolution live imaging. (A) Schematic of Mm tail fin injection and imaging in zebrafish larvae (created with BioRender online website, https://www.biorender.com, accessed on 30 January 2023). Fluorescently labeled Mm was microinjected into the tail fin of 3 dpf larvae. Live samples were mounted in low melting point agarose and imaged. Confocal laser scanning microscopy (CLSM) live imaging was performed on the region of interest (ROI) starting from 30 mpi. (B) Early events of Mm infection in the zebrafish tail fin. Transgenic (mpeg1.1:mCherry-F) zebrafish larvae, where macrophages are fluorescently labeled (pseudo color magenta), were infected with 100 CFU of E2-Crimson-labelled Mm (pseudocolor green). Images are maximum projection stills of the first 2 h of time-lapse (Supplementary Videos S1 and S2). At 30 mpi, the first macrophage containing a bacteria cluster is observed, arrow 1. In the next 30 min, the number of recruited macrophages increases, and phagocytic events are observed, arrow 2. At 93 mpi, a macrophage (arrow 3) approaches a second macrophage containing bacteria (arrow 4), and both have formed a single cell at 100 mpi (arrow 4′). Scale bar: 10 μm.

Acknowledgments
This image is the copyrighted work of the attributed author or publisher, and ZFIN has permission only to display this image to its users. Additional permissions should be obtained from the applicable author or publisher of the image. Full text @ Biology (Basel)