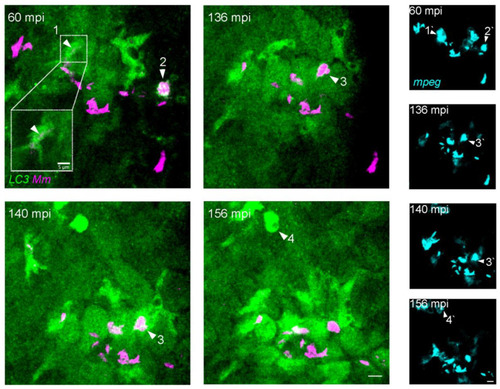
Mm infection induces an early LC3 increase in macrophages. Double transgenic (mpeg1.1:mCherry-F/CMV:GFP-LC3) zebrafish larvae, labeling macrophages (pseudo color cyan) and LC3 autophagy-related protein (green), were infected with 100 CFU of E2-crimson Mm (pseudo color magenta) following the TFI protocol. The figure shows the maximum projections of time-lapse crops of the injected area (Supplementary Video S3). Within the indicated time sequence from 60 and 156 mpi, macrophages are increasingly recruited to the site of infection. At 60 mpi, bacteria clusters are observed in association with the LC3 signal (arrowheads 1 and 2). The mpeg1.1:mCherry-F signal is shown separately to confirm the localization of the bacteria inside macrophages (arrowheads 1′ and 2′). The white square zooms in on arrowhead1, where a selection of the Z-stack is shown to unmasks the Mm cluster from the LC3 signal. Note that the high bacterial load of some macrophages at 60 mpi was comparable to the 93 mpi time point in Figure 1, suggesting slight differences in the injected dose. The level of LC3 signal in macrophages increases over time in infected (arrowheads 3/3′) and uninfected macrophages (arrowheads 4/4′). Scale bar: 10 μm.
|
