IMAGE

Figure 6

ID
ZDB-IMAGE-230630-115
Source
Figures for Muñoz-Sánchez et al., 2023
Image
Figure Caption

Figure 6

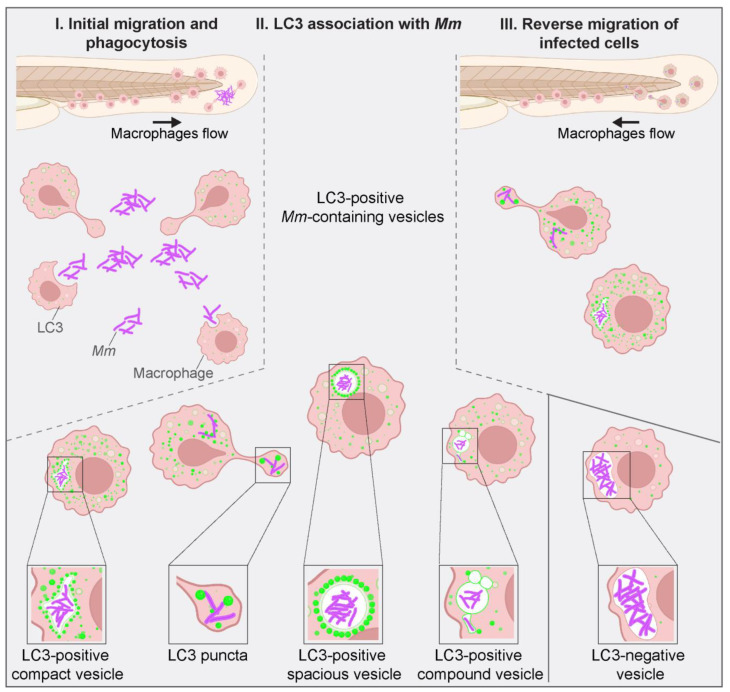
Schematic overview of LC3-associations with Mm-containing vesicles. Zebrafish in vivo imaging of Mm infection using the TFI protocol allowed us to distinguish between different LC3-vesicle membrane associations upon Mm infection. Macrophages are recruited to the site of infection at <30 mpi, and initial phagocytosis is observed at 30 mpi (Figure 1). At 60 mpi, LC3-vesicle membrane associations are visible in the proximity of bacterial clusters and colocalizing with them (Figure 4). The scheme illustrates the typically observed shapes: LC3-positive compact vesicle (Figure 2), LC3 puncta (Figure 4), LC3-positive spacious vesicle (Figure 5), and LC3-positive compound vesicles (Figure 3). Around 200 mpi, cells carrying bacteria inside LC3-positive vesicles were seen migrating away from the site of infection towards the caudal vein area, possibly disseminating the infection. Such motility was not observed for cells containing large LC3-negative bacterial clusters. Figure created with BioRender.

Acknowledgments
This image is the copyrighted work of the attributed author or publisher, and ZFIN has permission only to display this image to its users. Additional permissions should be obtained from the applicable author or publisher of the image. Full text @ Biology (Basel)