
- Title
-
Parallels between oncogene-driven cardiac hyperplasia and heart regeneration in zebrafish
- Authors
- Pfefferli, C., Bonvin, M., Grepper, D., Robatel, S., König, D., Lischer, H.E.L., Bruggmann, R., Jaźwińska, A.
- Source
- Full text @ Development
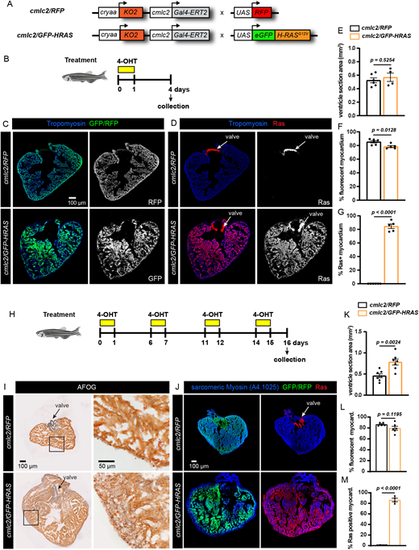
Inducible oncogenic HRASG12V leads to cardiac overgrowth in adult zebrafish. (A) Schematic representation of the transgenic strains used for inducible expression of oncogenic HRASG12V in the heart. The construct with cmlc2:Gal4-ERT2 is linked to a lens marker, cryaa:KO2, to facilitate identification of transgenic fish. These fish were crossed with either UAS:mRFP1 (cmlc2/RFP, control) or UAS:eGFP-HRASG12V (cmlc2/GFP-HRAS, an oncogenic protein fused with eGFP). (B) Experimental design with one treatment of 2.5 µM hydroxytamoxifen (4-OHT) for 18 h, followed by 3 days of recovery. (C,D) Transverse sections of ventricles isolated from fish in the experiment illustrated in B. GFP represents the endogenous fluorescence. RFP, RAS and Tropomyosin were detected by immunofluorescence. (E-G) Quantification of different parameters, as indicated on the y-axis, in the experiment presented in A-D. Each dot on the graph corresponds to one heart and it represents an average of three non-adjacent sections (spaced by ∼100 µm). Error bars indicate s.e.m. P-values are calculated using unpaired two-tailed t-test. n≥4. (H) Experimental design with four pulses of 2.5 µM 4-OHT treatment, each treatment was carried out for 18 h. (I,J) Transverse sections of ventricles isolated from fish in the experiment illustrated in H. (K-M) Quantifications of different parameters, as indicated on the y-axis, in the experiment presented in H-J. n≥4. Data are mean±s.e.m.; unpaired two-tailed t-test. |
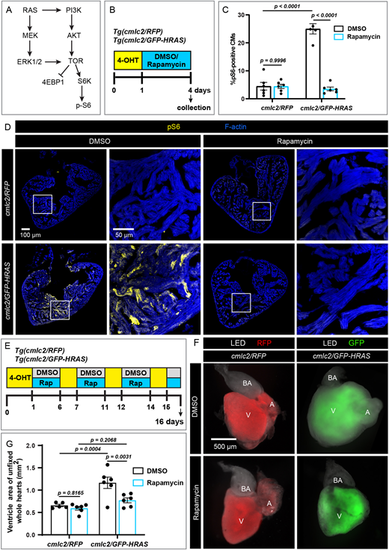
Inhibition of TOR signaling rescues from GFP-HRASG12V-induced cardiac overgrowth. (A) A simplified scheme of the RAS signaling cascade to indicate two downstream branches: MEK/ERK and AKT/TOR. (B) Experimental design with one 4-OHT treatment, followed by 3 days of treatments with 0.5 µM rapamycin or 0.05% DMSO. (C) Quantification of pS6 in the experiment presented in B. n≥5. Data are mean±s.e.m; two-way ANOVA with Šidák multiple comparisons test. (D) Transverse sections of ventricles isolated from fish in the experiment illustrated in B, fluorescently stained for pS6 and F-actin. The areas that are shown at higher magnification are outlined. n≥5. (E) Experimental design with four pulses of 4-OHT interspaced with either rapamycin or DMSO treatments. (F) Dissected unfixed hearts from the experiment depicted in E illuminated with LED and UV light with RFP (red) or GFP3 (green) filters. Transgene expression appears weaker in the atrium than in the ventricle, probably owing to differences in the trabecular density in both chambers. A, atrium; BA, bulbus arteriosus; V, ventricle. (G) Quantification of ventricle size, measured as the area of the chamber and representatively shown in F. n≥5. Data are mean±s.e.m; two-way ANOVA with Šidák multiple comparisons test. |
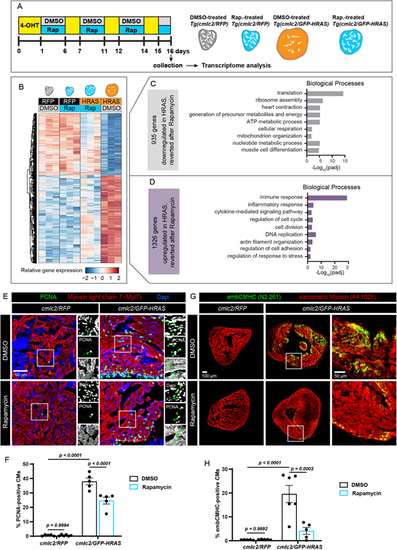
Molecular mechanisms of the rapamycin-mediated rescue from the oncogene-driven phenotype. (A) Experimental design for RNA-sequencing of ventricles. Rap, rapamycin. (B) Heatmap with hierarchical clustering of log2-transformed normalized read counts for genes that are differentially expressed in DMSO-treated cmlc2/GFP-HRAS, compared with cmlc2/RFP control, but that become reverted after rapamycin treatment (padj<0.05, absolute fold change >1.5). Three hearts were pooled per sample and biological triplicates were used for each experimental condition. Columns indicate the expression average of the three replicates for each group. Rows represent individual genes. Red corresponds to high expression and blue indicates low expression. (C) Selected enriched gene ontology terms for the 935 genes that were downregulated in HRAS-OE hearts but reverted after rapamycin. (D) Selected enriched gene ontology terms for the 1326 genes that were upregulated genes in HRAS-OE hearts but reverted after rapamycin. (E,G) Immunofluorescence analysis of ventricular sections from the experiment illustrated in Fig. 2E,F. The areas that are shown at higher magnification are outlined. Arrowheads in E indicate triple-positive proliferative cardiac nuclei. n≥5. (F,H) Quantifications of data representatively shown in E and G, respectively. n≥5. Data are mean±s.e.m; two-way ANOVA with Šidák multiple comparisons test. |
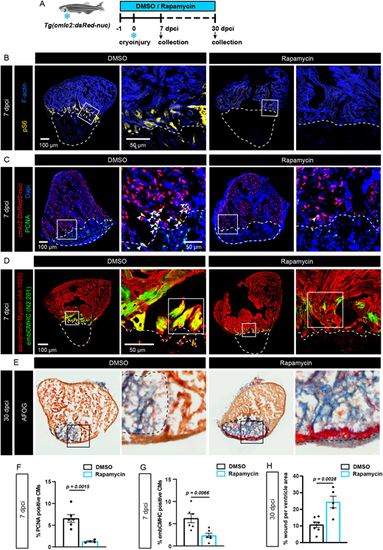
The TOR pathway is activated in the peri-injury zone during heart regeneration after cryoinjury. (A) Experimental design of the heart regeneration experiment in Tg(cmlc2:dsRed2-nuc) fish with 1 µM rapamycin or 0.1% DMSO treatments. dpci, days post-cryoinjury. (B-D) Immunofluorescence staining of hearts isolated from the experiment shown in A at 7 dpci. The cryoinjured area is outlined with a dashed line. Arrowheads in C indicate PCNA/dsRed2-positive nuclei. n≥5. (E) AFOG histological staining showing the myocardium in orange, fibrin in red and collagen in blue at 30 dpci. n≥5. (F-H) Quantification of data representatively shown in C-E. n≥5. Data are mean±s.e.m.; two-way ANOVA with Šidák multiple comparisons test. |
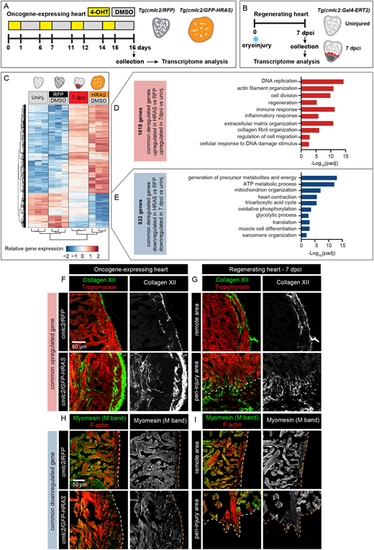
Commonly deregulated genes in HRAS-OE hearts and regenerating hearts. (A,B) Experimental design for transcriptomic analysis of oncogenic HRAS-expressing hearts (A) and regenerating hearts (B) with the controls. The transgenic strains are indicated above the heart drawing. Three hearts were pooled per samples and biological triplicates were used for each experimental condition. The HRAS-OE heart transcriptome shows similarity with 7 dpci regenerating heart, compared with their controls. (C) Heatmap with hierarchical clustering of log2-transformed normalized read counts for 2250 common differentially expressed (DE) genes in cmlc2/GFP-HRAS and in 7 dpci compared with their relevant control (padj<0.05, absolute fold change >1.5). Columns indicate the expression average of the three replicates for each group. Rows indicate individual genes. Red indicates high expression and blue indicates low expression. (D) Selected enriched gene ontology terms for the 1618 common upregulated genes in HRAS-OE and regenerating hearts representatively shown in C. (E) Selected enriched gene ontology terms for the 632 common downregulated genes in HRAS-OE and regenerating hearts representatively shown in C. (F-I) Immunofluorescence analysis of identified candidate genes commonly deregulated in HRAS-OE and regenerating heart at 7 dpci. (F) Extracellular matrix protein Collagen XII is enriched in the ventricle HRAS-expressing myocardium and the peri-injury zone at 7 dpci. (I) The sarcomeric protein Myomesin is downregulated in the ventricle HRAS-expressing myocardium and the peri-injury zone at 7 dpci. n=5. |
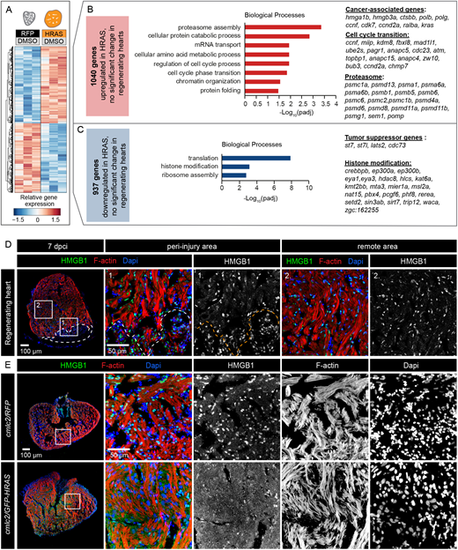
Unique DE genes of HRAS-OE hearts compared with regenerating hearts. (A) Heatmap of log2-transformed normalized expression values for genes exclusively deregulated in cmlc2/GFP-HRAS compared with cmlc2/RFP, without significant changes in 7 dpci compared with uninjured hearts. (B) Selected enriched gene ontology terms for the 1040 genes exclusively upregulated in HRAS-induced hearts. Cancer-associated, cell cycle transition and proteasome genes are indicated. (C) Selected enriched gene ontology terms for the 937 genes exclusively downregulated in HRAS-induced hearts. Examples of tumor suppressor genes and histone modifiers are listed. (D,E) Immunostaining of regenerating and HRAS-expressing hearts reveals differential subcellular localization of HMGB1. Only in HRAS-OE hearts is this protein non-nuclear. n=4. |
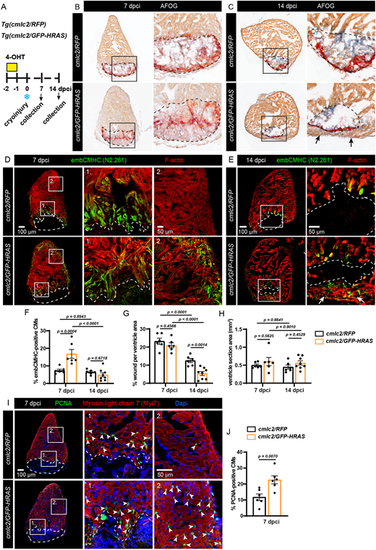
Short-term expression of oncogenic HRAS accelerates heart regeneration. (A) Experimental design and transgenic fish lines. One pulse of 4-OHT was given 2 days before cryoinjury. Hearts were collected at 7 and 14 dpci. (B,C) AFOG staining to visualize myocardium in orange, fibrin in red and collagen in blue. The cryoinjured area is outlined with a dashed line. At 14 dpci, a new myocardial layer forms around the wound margin, as indicated by arrows. (D,E) Immunostaining for embCMHC (N2.261 antibody) to detect immature cardiomyocytes, co-stained with F-actin. At 14 dpci, a myocardial ‘bridge’ spanning the continuity of the ventricular wall is indicated by arrows (four hearts out of eight). (F-H) Quantification of the data representatively shown in D and E. cmlc2/RFP at 7 and 14 dpci, n=6; cmlc2/GFP-HRAS at 7 dpci, n=6, cmlc2/GFP-HRAS at 14 dpci, n=8; error bars indicate s.e.m.; two-way ANOVA with Šidák multiple comparisons test. (I) Immunostaining against PCNA to detect proliferating cardiomyocytes, labeled with Myl7. n=6. Some proliferating cells are indicated with arrowheads. (J) Quantification of data representatively shown in I. n=6. Data are mean±s.e.m.; unpaired two-tailed t-test. |
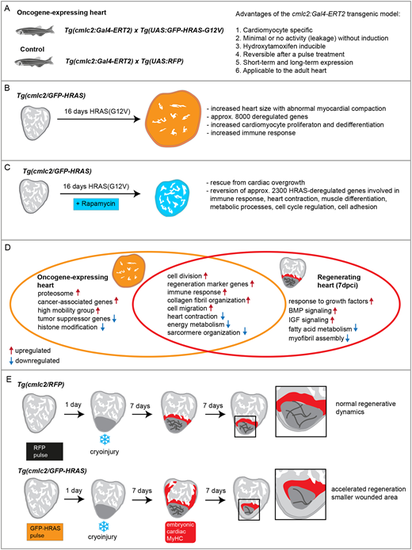
Parallels and contrast between HRAS-OE and regenerating ventricle in zebrafish. (A) Advantages of the newly established cmlc2:Gal4-ERT2 transgenic model. (B) Phenotypic and molecular characterization of the overgrowth caused by expression of the oncogenic HRASG12V for 16 days in the adult heart. (C) Molecular mechanisms underlying rescue of cardiac overgrowth by rapamycin treatment. (D) Selected genes, pathways and biological processes that are commonly and distinctively deregulated in HRAS-OE and regenerating hearts. (E) The beneficial effect of short-term expression of oncogenic HRAS on subsequent cardiac regeneration after cryoinjury. |