
Fig. 3
- ID
- ZDB-FIG-231108-47
- Publication
- Pfefferli et al., 2023 - Parallels between oncogene-driven cardiac hyperplasia and heart regeneration in zebrafish
- Other Figures
- All Figure Page
- Back to All Figure Page
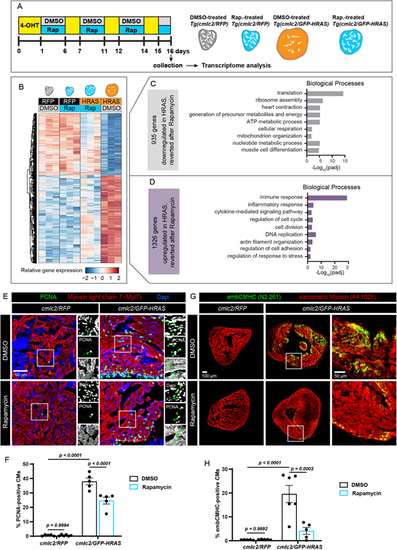
Molecular mechanisms of the rapamycin-mediated rescue from the oncogene-driven phenotype. (A) Experimental design for RNA-sequencing of ventricles. Rap, rapamycin. (B) Heatmap with hierarchical clustering of log2-transformed normalized read counts for genes that are differentially expressed in DMSO-treated cmlc2/GFP-HRAS, compared with cmlc2/RFP control, but that become reverted after rapamycin treatment (padj<0.05, absolute fold change >1.5). Three hearts were pooled per sample and biological triplicates were used for each experimental condition. Columns indicate the expression average of the three replicates for each group. Rows represent individual genes. Red corresponds to high expression and blue indicates low expression. (C) Selected enriched gene ontology terms for the 935 genes that were downregulated in HRAS-OE hearts but reverted after rapamycin. (D) Selected enriched gene ontology terms for the 1326 genes that were upregulated genes in HRAS-OE hearts but reverted after rapamycin. (E,G) Immunofluorescence analysis of ventricular sections from the experiment illustrated in Fig. 2E,F. The areas that are shown at higher magnification are outlined. Arrowheads in E indicate triple-positive proliferative cardiac nuclei. n≥5. (F,H) Quantifications of data representatively shown in E and G, respectively. n≥5. Data are mean±s.e.m; two-way ANOVA with Šidák multiple comparisons test. |