
|
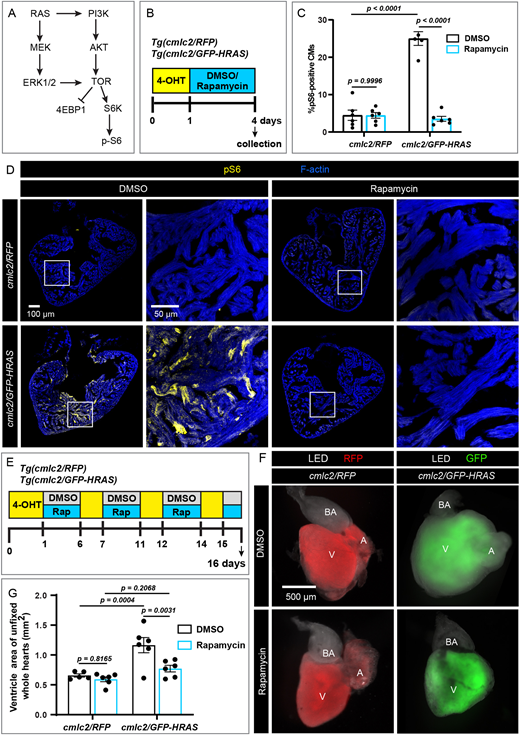
Fig. 2 Inhibition of TOR signaling rescues from GFP-HRASG12V-induced cardiac overgrowth. (A) A simplified scheme of the RAS signaling cascade to indicate two downstream branches: MEK/ERK and AKT/TOR. (B) Experimental design with one 4-OHT treatment, followed by 3 days of treatments with 0.5 µM rapamycin or 0.05% DMSO. (C) Quantification of pS6 in the experiment presented in B. n≥5. Data are mean±s.e.m; two-way ANOVA with Šidák multiple comparisons test. (D) Transverse sections of ventricles isolated from fish in the experiment illustrated in B, fluorescently stained for pS6 and F-actin. The areas that are shown at higher magnification are outlined. n≥5. (E) Experimental design with four pulses of 4-OHT interspaced with either rapamycin or DMSO treatments. (F) Dissected unfixed hearts from the experiment depicted in E illuminated with LED and UV light with RFP (red) or GFP3 (green) filters. Transgene expression appears weaker in the atrium than in the ventricle, probably owing to differences in the trabecular density in both chambers. A, atrium; BA, bulbus arteriosus; V, ventricle. (G) Quantification of ventricle size, measured as the area of the chamber and representatively shown in F. n≥5. Data are mean±s.e.m; two-way ANOVA with Šidák multiple comparisons test.