
- Title
-
TC-G 1008 facilitates epileptogenesis by acting selectively at the GPR39 receptor but non-selectively activates CREB in the hippocampus of pentylenetetrazole-kindled mice
- Authors
- Doboszewska, U., Socała, K., Pieróg, M., Nieoczym, D., Sawicki, J., Szafarz, M., Gawel, K., Rafało-Ulińska, A., Sajnóg, A., Wyska, E., Esguerra, C.V., Szewczyk, B., Maćkowiak, M., Barałkiewicz, D., Mlyniec, K., Nowak, G., Sowa, I., Wlaź, P.
- Source
- Full text @ Cell. Mol. Life Sci.

Experimental paradigm in mice. |
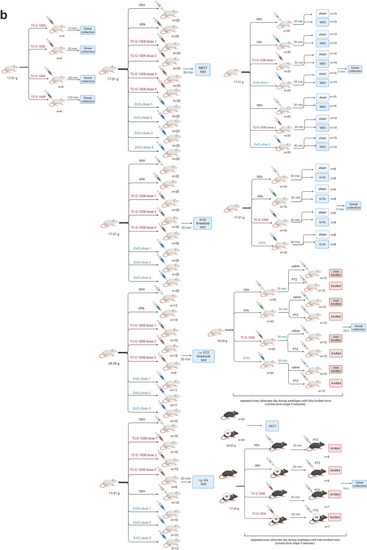
Experimental paradigm in mice. |

The concentrations of TC-G 1008 in the serum ( |

The effects of single doses of VPA ( |
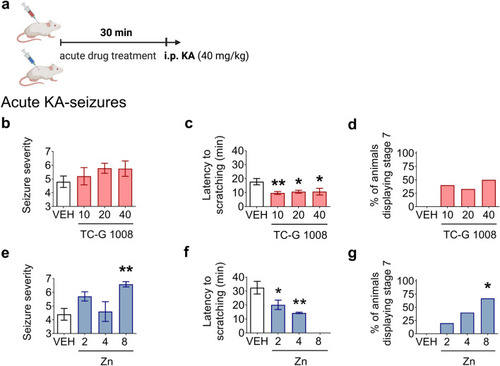
The effects of single doses of TC-G 1008 ( |
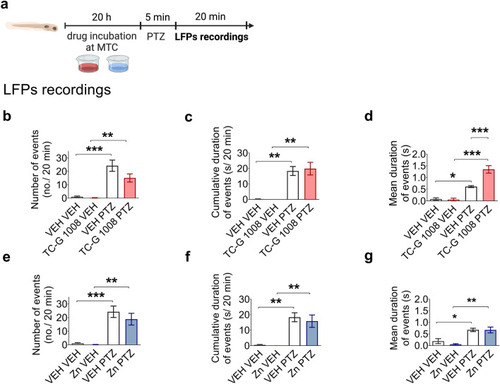
Local field potential (LFP) recordings from the optic tectum of zebrafish larvae exposed to TC-G 1008 ( |
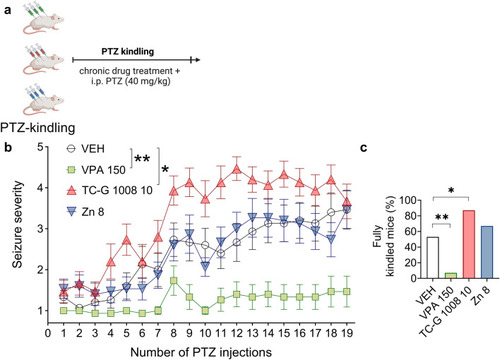
The effects of chronic treatment with VPA, TC-G 1008, or ZnCl2 on PTZ-induced epileptogenesis in Swiss Albino mice. |
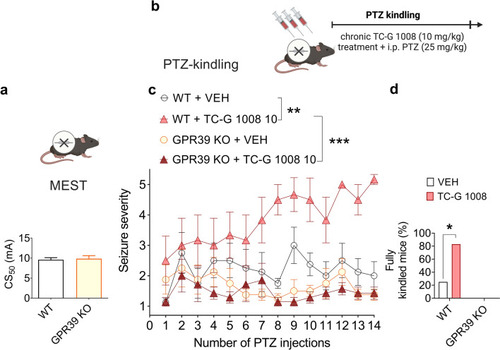
The effects of GPR39 KO in C57BL/6/Tar × CBA/Tar mice on seizure threshold in the MEST test ( |
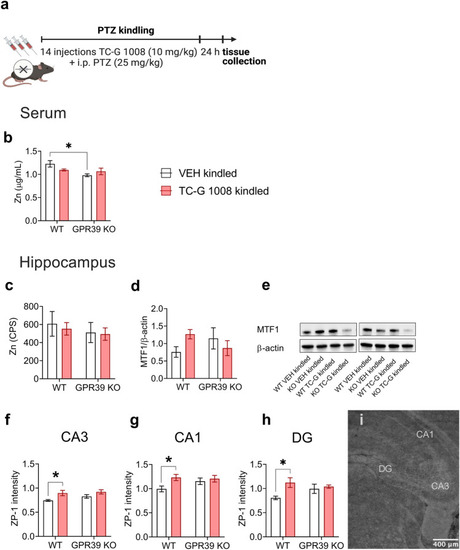
The effects of PTZ-kindling in GPR39 KO or WT mice and chronic treatment with TC-G 1008 (10 mg/kg) on zinc levels in serum and hippocampus. |
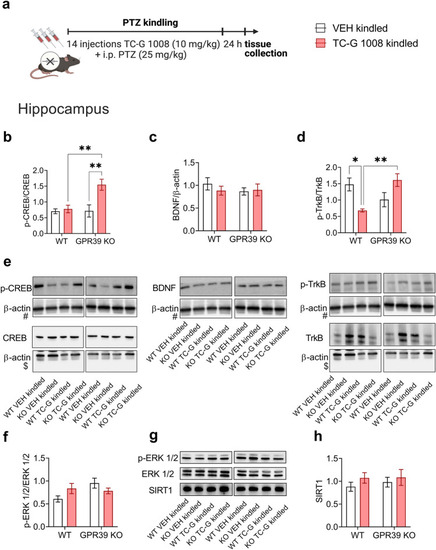
The effects of PTZ-kindling in GPR39 KO or WT (C57BL/6/Tar × CBA/Tar) mice and chronic treatment with TC-G 1008 (10 mg/kg) on the expression of proteins in the GPR39 signaling pathway in the hippocampus. |
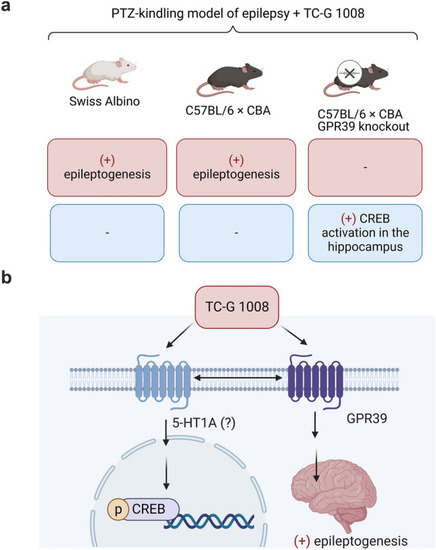
Summary of findings and the proposed mechanism. TC-G 1008 is a small molecule agonist at GPR39 [ |