FIGURE

Fig. 9

ID
ZDB-FIG-230518-44
Publication
Doboszewska et al., 2023 - TC-G 1008 facilitates epileptogenesis by acting selectively at the GPR39 receptor but non-selectively activates CREB in the hippocampus of pentylenetetrazole-kindled mice
Other Figures
All Figure Page
Back to All Figure Page
Fig. 9

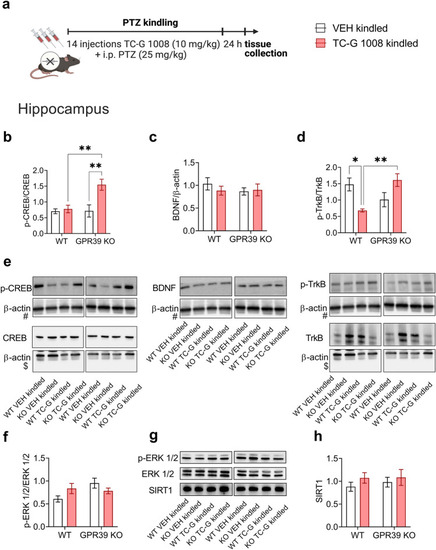
The effects of PTZ-kindling in GPR39 KO or WT (C57BL/6/Tar × CBA/Tar) mice and chronic treatment with TC-G 1008 (10 mg/kg) on the expression of proteins in the GPR39 signaling pathway in the hippocampus. a The PTZ kindling in GPR39 KO or WT (C57BL/6/Tar × CBA/Tar) mice consisted of 14 injections of PTZ (25 mg/kg). The biochemical analyses were performed 24 h after the last PTZ injection. bd The expression of p-CREB, CREB, BDNF, p-TrkB, and TrkB was normalized to β-actin. The results (means ± SEM) are shown as the p-CREB/CREB, BDNF/β-actin, or p-TrkB/TrkB. b n = 7 in each group. cd n = 6 in each group. e Representative blots of p-CREB, CREB (~ 46 kDa), BDNF (~ 14 kDa), p-TrkB, TrkB (~ 140 kDa), and β-actin (~ 42 kDa). #p-CREB, BDNF, and p-TrkB come from the same blot; $CREB and TrkB come from the same blot, thus sharing the corresponding β-actin band. f, h The expression p-ERK1/2, ERK1/2, and SIRT1 was normalized to the total protein concentration. f The results (means ± SEM) are shown as p-ERK1/2/ERK1/2. n = 6 WT VEH, n = 6 WT TC-G 1008, n = 7 KO VEH, n = 7 KO TC-G 1008. h n = 7 WT VEH, n = 6 WT TC-G 1008, n = 5 KO VEH, n = 6 KO TC-G 100. g Representative blots of p-ERK1/2, ERK1/2 (~ 44, 42 kDa) and SIRT1 (the observed band ~ 130 kDa). p values were determined by two-way ANOVA and Bonferroni’s multiple comparison test. *p < 0.05, **p < 0.01

Expression Data

Expression Detail
Antibody Labeling
Phenotype Data

Phenotype Detail
Acknowledgments
This image is the copyrighted work of the attributed author or publisher, and ZFIN has permission only to display this image to its users. Additional permissions should be obtained from the applicable author or publisher of the image. Full text @ Cell. Mol. Life Sci.