
- Title
-
The sinusoidal hematopoietic niche is formed by Jam1a via Notch signaling in the zebrafish kidney
- Authors
- Kondo, M., Kimura, K., Kobayashi-Sun, J., Yamamori, S., Taniguchi, M., Traver, D., Kobayashi, I.
- Source
- Full text @ iScience
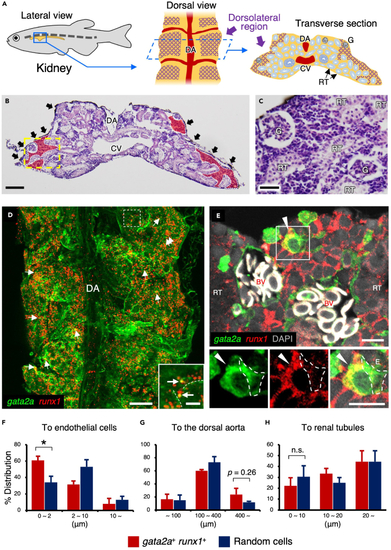
gata2a+runx1+ HSPCs are closely associated with vascular endothelial cells in the kidney (A) Schematic diagram of zebrafish kidney. Lateral view (left), dorsal view (middle), and transverse section of the kidney (right) are shown. The purple cross-hatching portion denotes the dorsolateral region of the kidney. (B and C) Hematoxylin and eosin staining of zebrafish kidney. Red areas and black arrows denote kidney marrow and melanocytes observed in the dorsal surface of the kidney. A high magnification view of the yellow dotted area is shown in C. (D) Dorsal view of a gata2a:GFP; runx1:mCherry kidney. Inset shows the high magnification view of the white dotted area. Arrows and dotted lines indicate gata2a+runx1+ cells and endothelial cells, respectively. (E) Transverse section of a gata2a:GFP; runx1:mCherry kidney. Insets show the green (left), red (middle), and merged channel (right) of the white boxed area. Arrowheads indicate a gata2a+runx1+ cell, and white dotted lines outline a gata2a:GFP+ vascular endothelial cell. The section is oriented dorsal side up. Erythrocytes within blood vessels are observed in white due to auto-fluorescence. (F–H) Distance (μm) of individual gata2a+runx1+ cells or randomly selected cells from the endothelium, dorsal aorta, or renal tubule (total 82 cells from 3 zebrafish for the endothelium and dorsal aorta and total 36 cells from 3 zebrafish for renal tubules; error bars, s.d.). ∗p < 0.05; n.s., no significance; DA, dorsal aorta; CV, cardinal vein; G, glomerulus; RT, renal tubule; BV, blood vessels. Bars, 100 μm (B); 40 μm (C); 200 μm (D); 20 μm (insets in D); 10 μm (E). EXPRESSION / LABELING:
|
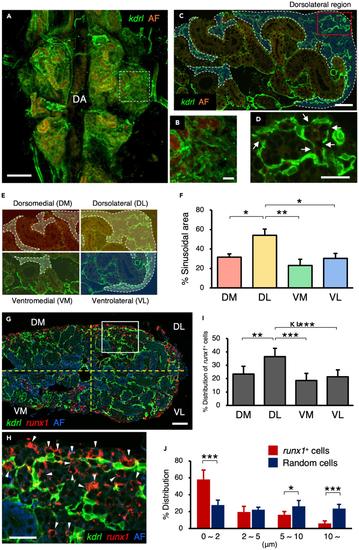
Sinusoids are formed in the dorsolateral region of the kidney (A and B) Dorsal view of a kdrl:Cerulean kidney. A high magnification view of the white dotted area is shown in B. (C and D) Transverse section of a kdrl:Cerulean kidney. Blue areas outlined by the white dotted line denote the sinusoidal area. A high magnification view of the red dotted area is shown in D. Arrows indicate the fenestra in the sinusoidal endothelium. (E and F) Quantification of sinusoidal area in the kidney. Kidney tissue was subdivided into 4 regions, dorsomedial (DM), dorsolateral (DL), ventromedial (VM), and ventrolateral (VL), and the percentage of sinusoidal area was quantified in each region (mean ± s.e.m; n = 6). (G and H) Transverse section of a kdrl:Cerulean; runx1:mCherry kidney. A high magnification view of the white boxed area is shown in H. Arrowheads in H indicate runx1+ cells detected in the sinusoidal area. AF in A–C, G, and H denotes auto-fluorescence of renal tubules or erythrocytes. (I and J) Percent distribution of runx1+ cells in each region (I) and distance (μm) of individual runx1+ cells or randomly selected cells from the kdrl:Cerulean+ sinusoidal endothelium (J) (total 904 runx1+ cells and 183 random cells from 4 zebrafish; error bars, s.d.). ∗p < 0.05; ∗∗p < 0.01; DA, dorsal aorta; Bars, 200 μm (A); 40 μm (B, C, G); 20 μm (D, H). EXPRESSION / LABELING:
|
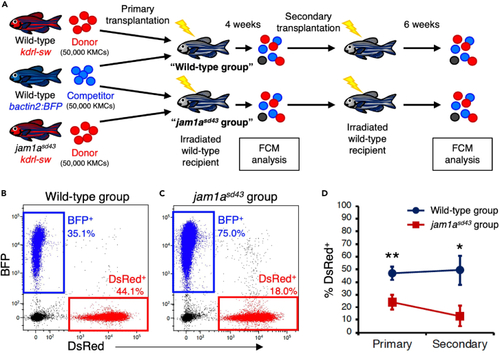
Serial transplantation assay for wild-type and jam1asd4 KMCs (A) Experimental procedure for serial transplantation assay. DsRed-labeled KMCs from wild-type or jam1asd43 animals were co-transplanted with equivalent numbers of BFP-labeled wild-type KMCs into sub lethally irradiated wild-type recipients (wild-type or jam1asd43 group). At 4 weeks post-transplantation (wpt), KMCs from each recipient group were analyzed by FCM and further transplanted into secondary recipients, followed by FCM analysis at 6 wpt. (B and C) Representative result of FCM analysis in recipients of wild-type or jam1asd43 group. (D) Percentages of dsRed+ cells within the total BFP+ or dsRed+ cells in each group (mean ± s.e.m; n = 35 (wild-type) or 33 (jam1asd43) for primary; n = 14 (wild-type) or 16 (jam1asd43) for secondary). ∗p < 0.05; ∗∗p < 0.01. |
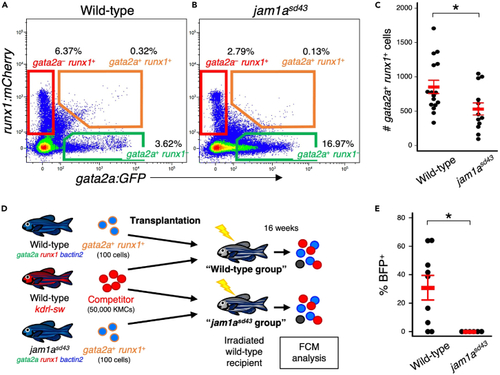
Loss of Jam1a reduces long-term hematopoietic reconstitution activity (A and B) Representative result of FCM analysis in KMCs from wild-type or jam1asd43 animals under a gata2a:GFP; runx1:mCherry background. (C) Absolute numbers of gata2a+runx1+ cells in the wild-type or jam1asd43 kidney (mean ± s.e.m; n = 16 [wild-type] or 13 [jam1asd43]). (D) Experimental procedure for competitive repopulation assay using gata2a+runx1+ cells. (E) Percentages of BFP+ cells within total BFP+ or dsRed+ cells in each group (mean ± s.e.m; n = 9 [wild-type] or 6 [jam1asd43]). ∗p < 0.05. PHENOTYPE:
|
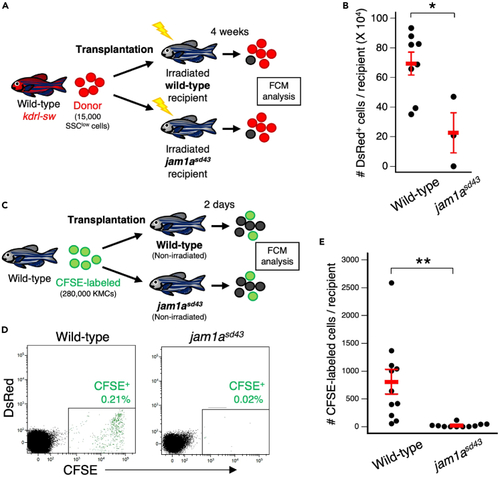
Loss of Jam1a results in a defect in hematopoietic niches (A) Experimental procedure for transplantation assay using wild-type or jam1asd43 recipients. (B) Absolute numbers of dsRed+ cells in wild-type or jam1asd43 recipients (mean ± s.e.m; n = 8 [wild-type] or 3 [jam1asd43]). (C) Experimental procedure for homing assay using wild-type or jam1asd43 recipients. (D) Representative result of FCM analysis in wild-type or jam1asd43 recipients. (E) Absolute numbers of CFSE-labeled cells in wild-type or jam1asd43 recipients (mean ± s.e.m; n = 11 for each). ∗p < 0.05; ∗∗p < 0.01. PHENOTYPE:
|
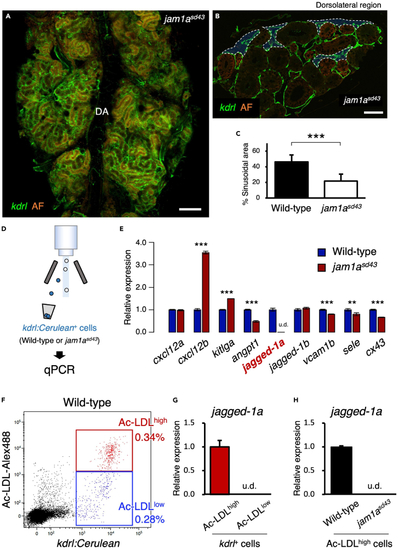
Sinusoids are reduced in the jam1asd43 kidney (A) Dorsal view of a jam1asd43kdrl:Cerulean kidney. DA, dorsal aorta. (B) Transverse section of a jam1asd43kdrl:Cerulean kidney. Blue areas outlined by the white dotted line denote the sinusoidal area. AF in A and B denotes auto-fluorescence of renal tubules. (C) Percentages of sinusoidal area in the wild-type or jam1asd43 kidney. Error bars, s.d. (n = 6 for each). (D) Schematic diagram of qPCR analysis in vascular endothelial cells from wild-type or jam1asd43 kidneys. (E) Expression of niche factor genes in vascular endothelial cells from wild-type or jam1asd43 kidneys. Error bars, s.d. (n = 4 for each). (F) Representative result of FCM analysis in wild-type kdrl:Cerulean animals injected with Alexa Fluor 488-conjugated Ac-LDL. kdrl:Cerulean+ endothelial cells were subdivided into two populations, Ac-LDLhigh and Ac-LDLlow. (G and H) Expression of jagged-1a in Ac-LDLhigh or Ac-LDLlow endothelial cells of wild-type animals (G) or in Ac-LDLhigh endothelial cells from wild-type or jam1asd43 kidneys (H). Error bars, s.d. (n = 4 for each). u.d., undetected. Bars, 200 μm (A); 40 μm (B); ∗∗p < 0.01; ∗∗∗p < 0.001. |
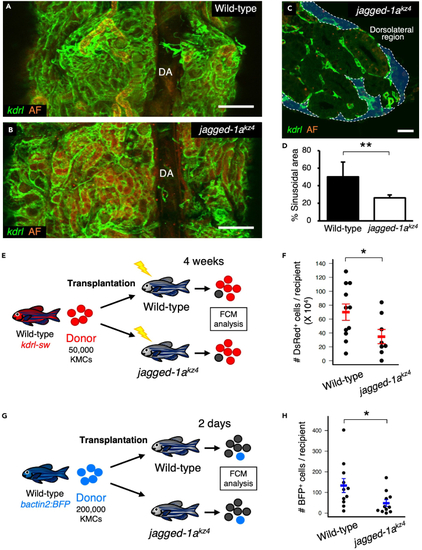
Loss of Jagged-1a results in a defect in hematopoietic niches (A and B) Dorsal view of a wild-type or jagged-1akz4 kidney. (C) Transverse section of a jagged-1akz4 kidney under a kdrl:Cerulean background. Blue areas outlined by the white dotted line denote the sinusoidal area. (D) Percentages of sinusoidal area in the wild-type or jagged-1akz4 kidney. Error bars, s.d. (n = 4 for each). (E) Experimental procedure for transplantation assay using wild-type or jagged-1akz4 recipients. (F) Absolute numbers of dsRed+ cells in wild-type or jagged-1akz4 recipients (mean ± s.e.m; n = 11 [wild-type] or 8 [jagged-1akz4]). (G) Experimental procedure for homing assay using wild-type or jagged-1akz4 recipients. (H) Absolute numbers of BFP+ cells in wild-type or jagged-1akz4 recipients (mean ± s.e.m; n = 11 for each). AF in A-C denotes auto-fluorescence of renal tubules. ∗p < 0.05; ∗∗p < 0.01. Bars, 200 μm (A and B); 20 μm (C). |
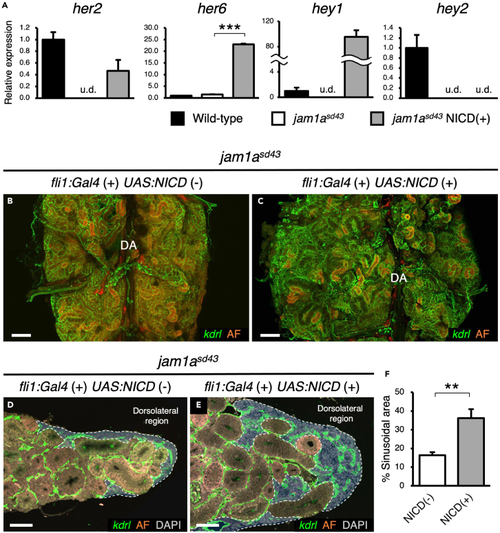
Forced activation of Notch recovers sinusoids in the jam1asd43 kidney (A) Relative expression of Notch target genes, her2, her6, hey1, and hey2, in kdrl:Celurean+ Ac-LDLhigh sinusoidal endothelial cells from wild-type, jam1asd43, or jam1asd43 expressing NICD. u.d., undetected. Error bars, s.d. (n = 3 for each). (B–E) Dorsal view (B and C) and transverse section (D and E) of a jam1asd43 kidney expressing or not NICD under control of fli1:Gal4 induction. Blue areas outlined by the white dotted line in D and E denote the sinusoidal area. AF denotes auto-fluorescence of renal tubules. (F) Percentages of sinusoidal area in the jam1asd43 kidney expressing or not NICD under control of fli1:Gal4 induction. Error bars, s.d. (n = 4 for each). ∗∗p < 0.01; ∗∗∗p < 0.001. Bars, 200 μm (B and C); 40 μm (D and E). |

Characterization of jam1asd43 zebrafish (related to Figure 3, 4, ,5 and 6) (A, B) Expression of Jam1a in kidney under a kdrl:NTR-cerulean background. A high magnification view of the white dotted area is shown in B. Arrowheads indicate Jam1a expression detected in the sinusoidal endothelium. (C) Mutation in exon 3 of jam1a was verified by sequencing in wild-type orjam1asd43 embryos. (D) Schematic diagram of the predicted Jam1a protein in wild-type or jam1asd43 animals. Ig, immunoglobulin-like domain; TM, transmembrane domain; PBM, PDZ-binding motif; aa, amino acid. (E, F) Images of wild-type and jam1asd43 zebrafish at 4 months of age. (G) Body weights of wild-type and jam1asd43 animals at 3 to 6 months of age. Error bar, s.d. (n = 8 (wild-type male), 16 (jam1asd43 female), 14 (wild-type female), or 5 (jam1asd43 female). (H, L) Expression of Jam1a and GAPDH in wild-type or jam1asd43 embryos. (J, K) Expression of Jam1a in the collecting duct (CD) and tubule (CT) of wild-type or jam1asd43 animals. (L, M) Expression of runx1 in wild-type or jam1asd43 embryos. Arrowheads indicate runx1 expression in the dorsal aorta. (N) Quantitative phenotype distribution of runx1 expression in wild-type 1(2 = 36) or jam1asd43 embryos (n = 31). Bars, 10 mm (E, F); 100 μm (L, M); 20 μm (A,J,K); 10 μm (B ). **p ≤ 0.01; ***P < 0.001; n.s. no significance. |