
Image
|
Figure Caption
Figure 5
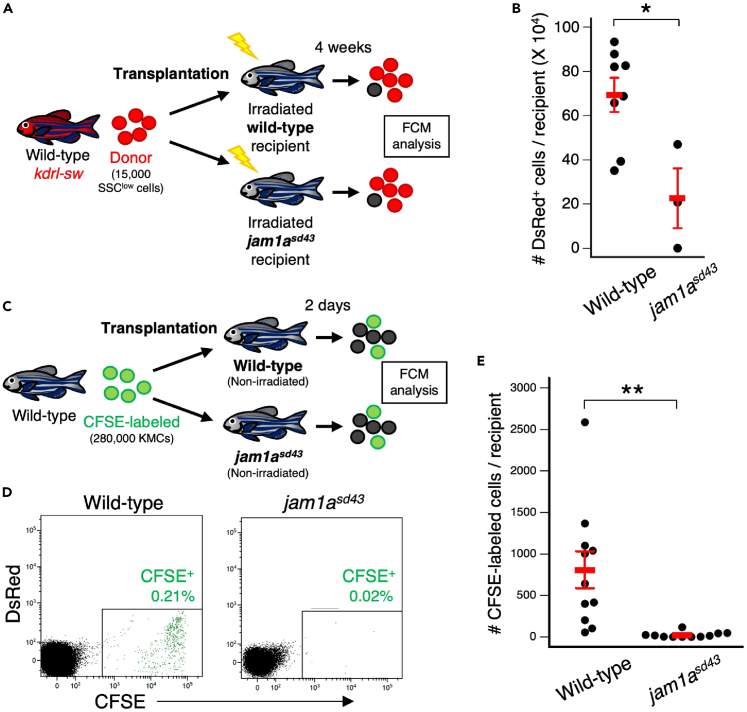
Loss of Jam1a results in a defect in hematopoietic niches
(A) Experimental procedure for transplantation assay using wild-type or jam1asd43 recipients.
(B) Absolute numbers of dsRed+ cells in wild-type or jam1asd43 recipients (mean ± s.e.m; n = 8 [wild-type] or 3 [jam1asd43]).
(C) Experimental procedure for homing assay using wild-type or jam1asd43 recipients.
(D) Representative result of FCM analysis in wild-type or jam1asd43 recipients.
(E) Absolute numbers of CFSE-labeled cells in wild-type or jam1asd43 recipients (mean ± s.e.m; n = 11 for each). ∗p < 0.05; ∗∗p < 0.01.
Figure Data
Acknowledgments
This image is the copyrighted work of the attributed author or publisher, and
ZFIN has permission only to display this image to its users.
Additional permissions should be obtained from the applicable author or publisher of the image.
Full text @ iScience