
|
Figure 7
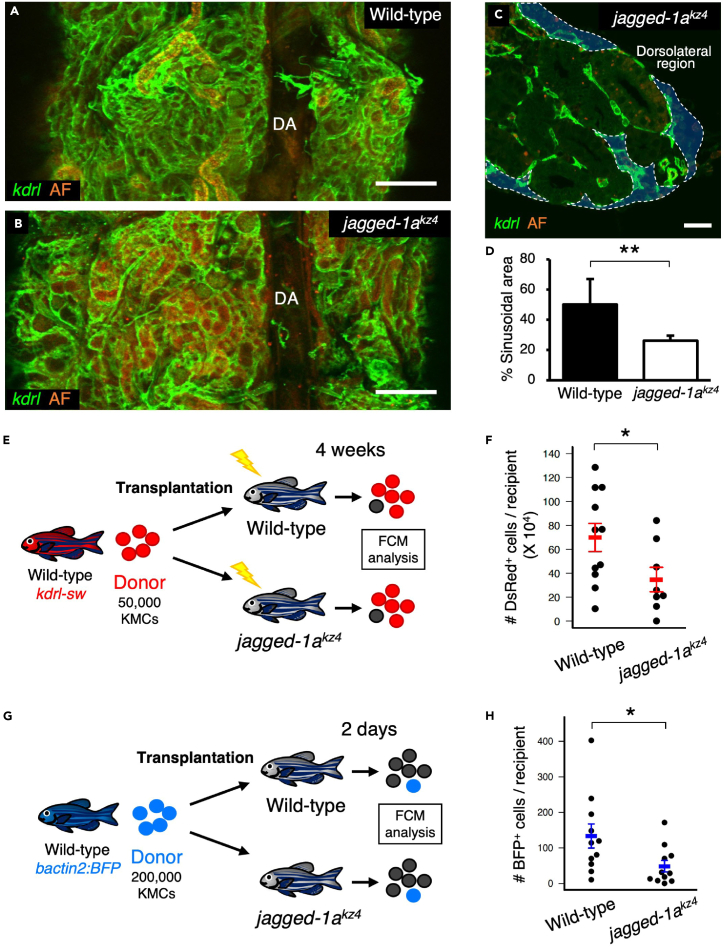
Loss of Jagged-1a results in a defect in hematopoietic niches
(A and B) Dorsal view of a wild-type or jagged-1akz4 kidney.
(C) Transverse section of a jagged-1akz4 kidney under a kdrl:Cerulean background. Blue areas outlined by the white dotted line denote the sinusoidal area.
(D) Percentages of sinusoidal area in the wild-type or jagged-1akz4 kidney. Error bars, s.d. (n = 4 for each).
(E) Experimental procedure for transplantation assay using wild-type or jagged-1akz4 recipients.
(F) Absolute numbers of dsRed+ cells in wild-type or jagged-1akz4 recipients (mean ± s.e.m; n = 11 [wild-type] or 8 [jagged-1akz4]).
(G) Experimental procedure for homing assay using wild-type or jagged-1akz4 recipients.
(H) Absolute numbers of BFP+ cells in wild-type or jagged-1akz4 recipients (mean ± s.e.m; n = 11 for each). AF in A-C denotes auto-fluorescence of renal tubules. ∗p < 0.05; ∗∗p < 0.01. Bars, 200 μm (A and B); 20 μm (C).